


 369 / 392

365
0
2
4
6
8
10
12
0
5
10
15
20
∆
U [mV]
F [kN]
F
i
δ
i
=CTOD(F
i
)
0
2000
4000
6000
0
0,5
1
1,5
2
CMOD [mm]
F [N]
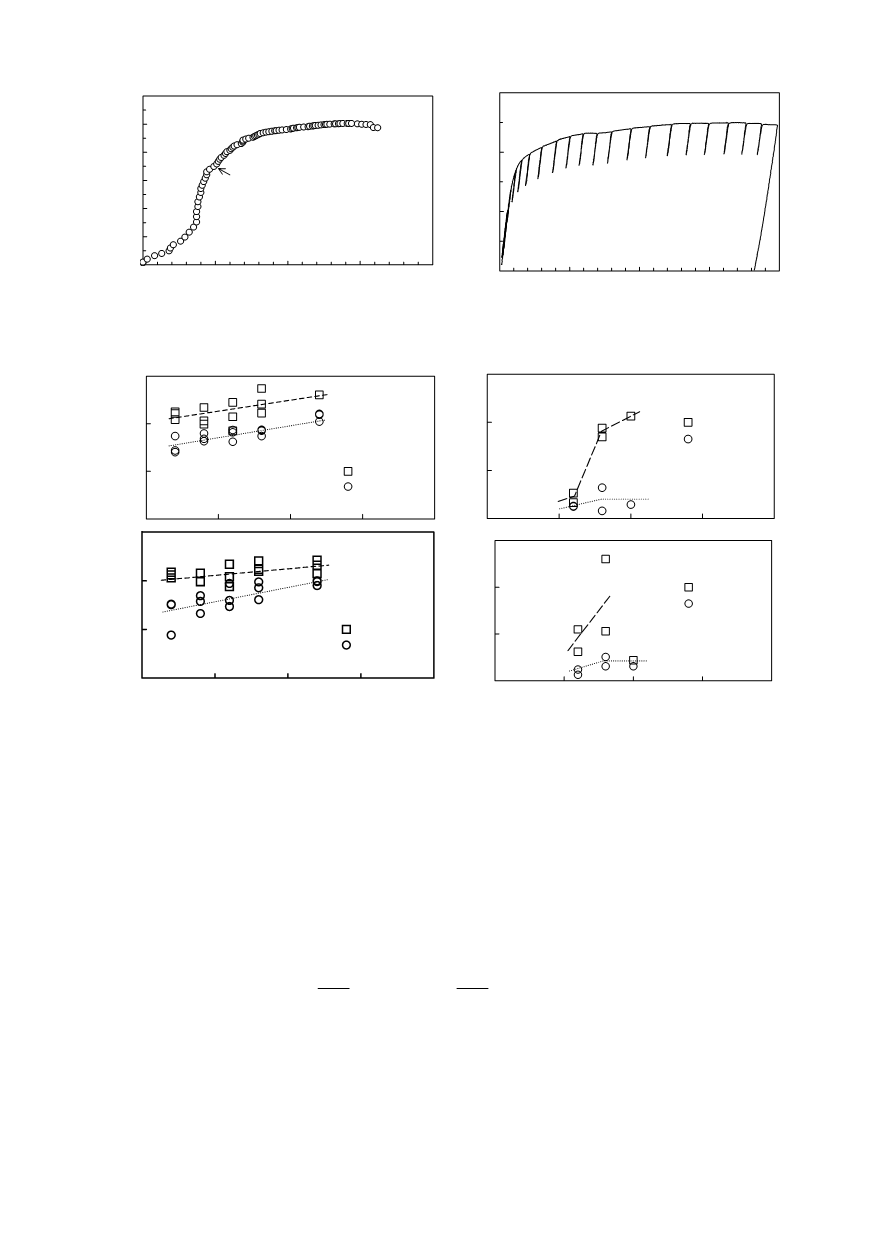
Figure 17. Detection of crack initiation by the potential drop method (left), and
the compliance method (right)
0
25
K
Q
[
CGHAZ
ICCGHAZ
50
75
MPam
0
1/2
]
∆
t
8/5
=10 s
0,1
δ
Q
0,2
[mm]
CGH
ICCG
0,3
AZ
HAZ
∆
t
8/5
=10 s
0
25
50
75
-100
-50
0
50
100
T [°C]
K
Q
[MPam
1/2
]
CGHAZ
ICCGHAZ
∆
t
8/5
=30 s
0
0,1
0,2
0,3
-100
-50
0
50
100
T [°C]
δ
Q
[mm]
CGHAZ
ICCGHAZ
∆
t
8/5
=30 s
Figure 18. Provisional stress intensity factor,
K
Q
, determined on round tensile specimens (left), and
provisional crack-tip opening displacement,
δ
Q
, determined on three-point-bend specimens (right),
for
∆
t
= 10 s (above) a for
∆
t
= 30 s (below)
Series
own in
Fig. 14. In general, two HAZ sub-zones fro
structural steel Niomol
490K were treated [21]. The provisional fracture toughness results,
K
Q
, for round tensile
specimens are given in Fig. 18–left, and
δ
Q
–values for three-point-bend specimens in
Fig. 18–right. Mostly the size of specimens was not sufficient for
K
I
c
measurement, espe-
cially bend specimens, because the following conditions were not fulfilled:
nd
8/5
8/5
of tests were performed at different temperatures on specimens sh
m welds in the HSLA
2
2
I
I
1 5
;
2 5
c
c
p
p
K
K
D .
B .
R
R
⎛ ⎞
⎛
⎞
≥
≥
⎜ ⎟
⎜
⎟
⎜ ⎟
⎜
⎟
⎝ ⎠
⎝
⎠
(8)
where
D
and
B
are the round tensile specimen diameter [18], and the rectangular three-
point bend specimen thickness [16], respectively, whereas
R
p
is the yield strength.
For further evaluation, the experimental force vs. load-line displacement diagrams (
F–
LLD
) and force vs. crack-mouth opening displacement diagrams (
F–CMOD
) were
adapted according to the equivalent-energy method, the idea described in reference [22]
and shown in Fig. 19.