


 374 / 392

EGP
[
µ
m]
Fatigue strength
∆σ
e
[MPa]
200
100
50
25
2
1
500
400
surface with
micro-defects
smooth
surface
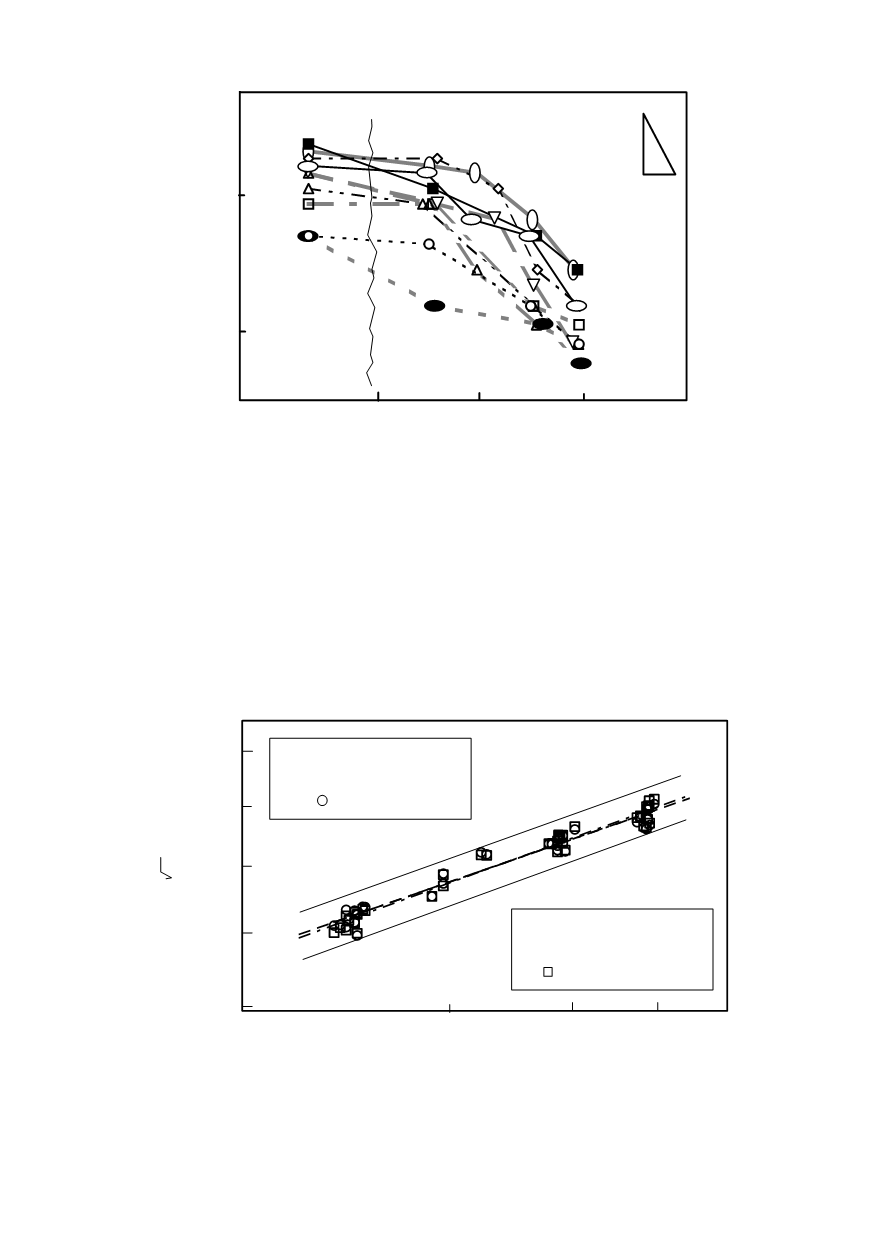
Figure 25. The fatigue strength for twelve different structures in HA
The
factor
range,
nd on
the siz
ed by two
em
Z
final conclusion of this research was that the threshold stress intensity
∆
K
th
, of discussed HAZ zones depend on their ultimate tensile strength,
R
m
, a
e of artificial defects expressed by EGP
.
Their relations are express
pirical formulas: in Eq. (13) the Goodman criterion is applied, whereas in Eq. (14) the
criterion of Gerber is used,
3
0.35
(1.20 10
0.485) EGP
th
m
K
R
−
∆ = ×
+
(13)
3
0.33
(1.13 10
0.730) EGP
th
m
K
R
−
∆ = ×
+
(14)
The effect is clearly shown in Fig. 26.
370
log Y = 0,33 · log X - 2,59
R
2
= 0,96
Gerber
log Y = 0,35 · log X - 2,62
R
2
= 0,96
Goodman
EGP [
µ
m]
∆Κ
th
/(A· R
m
+B)
(
∆Κ
th
- [MPa m], R
m
- [MP
100
0.008
0.009
0.011
0.010
25
50
75
125
a])
0.012
Figure 26. The threshold stress intensity factor range normalised with the strength of the material