


 368 / 392

364
0
10
20
F [kN]
30
0
0,4
0,8
1,2
LLD [mm]
F-LLD
- 4 %
40
F
c
F
Q
=F
c
0
40
F
c
F
c
/F
Q
= 1,5
30
0
0,4
0,8
1,2
LLD [mm]
F
Q
10
20
F [kN]
F-LLD
- 4 %
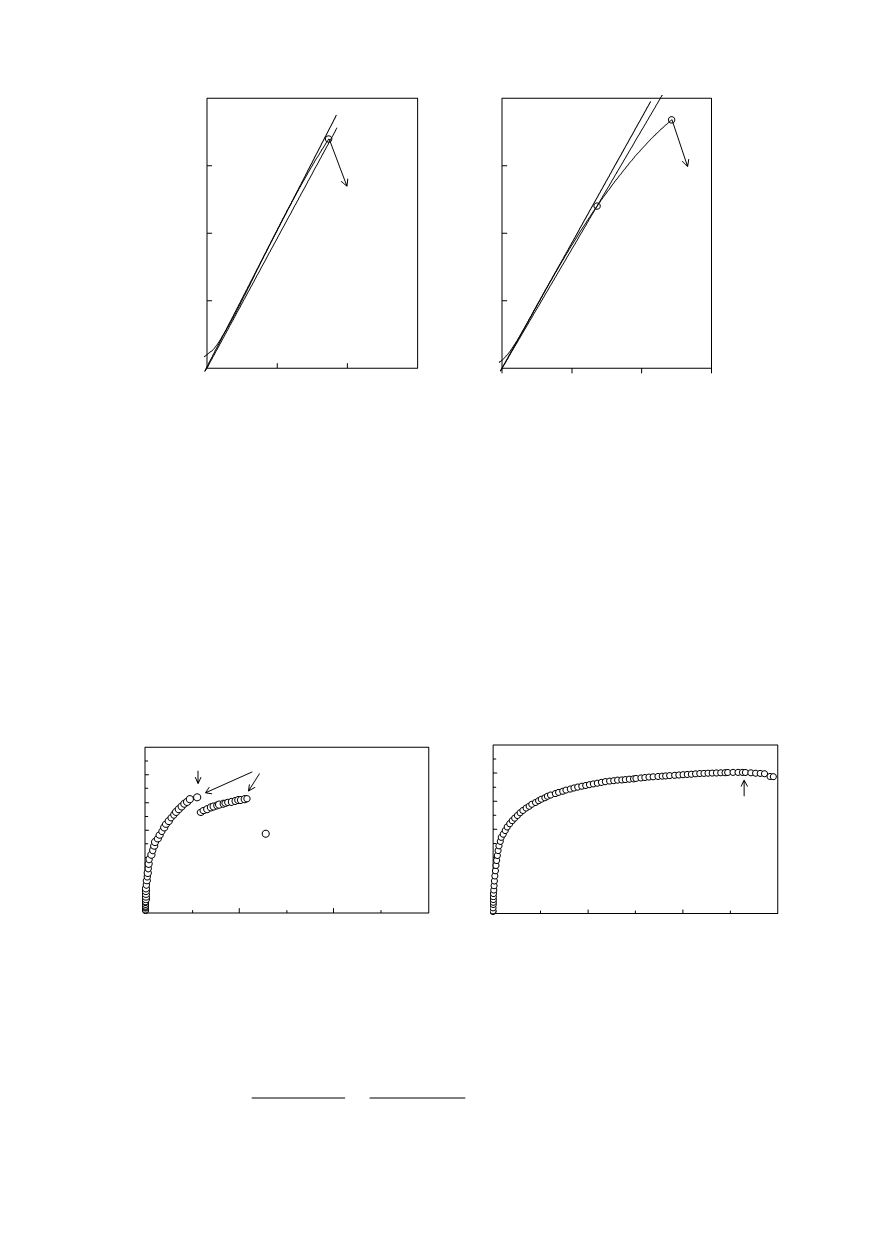
Figure 15. Acceptable linear (left), and non-linear
F
–
LLD
(
∆
l
) diagrams. Only acceptable linear
behaviour can be used for plane-strain fracture toughness
K
I
c
determination
The three point bend specimens, 8×15×70 mm in size (Fig. 14–right), were machine
pre-notched for 5 mm on one side in the
n of the simulated microstructure. The
specime
fatigue
pre-crack 2.5
intensity factor,
K
max
, during precracking that ensures a negligible influence on fracture
toughness was determined according to the standard in reference [20].
Specimens can be loaded up to fracture (Fig. 15), or during stable crack growth with sig-
nificant pop-in effect (Fig. 16–left) or, even beyond maximum load
F
m
(Fig. 16–right) [13].
In case of stable crack growth, the single specimen method can be used by applying
the potential drop method (Fig. 17–left) [13], or compliance measurement technique
(Fig. 17–right) [21].
regio
ns were loaded using repetitive bending at a loading ratio
R
≤
0.1 to form
mm in crack length to width ratio
a
/
W
of about 0.5. The maximum stress-
0
0
0,1
0,2
0,3
CTOD [mm]
2
4
6
8
10
12
F [kN]
F
c
δ
c
=CTOD(F
c
)
pop-in
0
0
0,1
0,2
0,
2
4
6
8
10
12
3
CTOD [mm]
F [kN]
F
m
δ
m
=CTOD(F
m
)
Figure 16. Fracture mechanics experiments: quasi-brittle fracture initiation occurred, expressed by
typical pop-in (left); stable-crack growth, with expessed plastic behaviour (right)
An appropriate crack tip opening displacement (CTOD) value (
δ
i
,
δ
c
or
δ
0.2
) can be
calculated after determined position of crack initiation (
F
i
), as follows [20]:
2 2
1
0.4
CMOD
2
0.4 0.6
p
p
δ
R E
W a
=
+
+
(7)
( µ ) K
(W a)
−
−