


 372 / 392

2
4
4
y
r
πd
dS
S
S
d
= → = −
(10)
(
)
y
r
dS
S B W a
S W a
= − → = −
−
(11)
Taking into account actual dimensions of both types of specimens (5
≤
d
≤
6 mm and
W
−
a
≅
7.5 mm) the ratio of relative cross-section reductions is:
1
2
4(
)
:
5 to 6
dS dS
W a
S S
d
− =
=
(12)
The effect of plastic zone size on experimentally determined fracture toughness would
be 5 to 6 times higher on tensile
specimens than on three-point bend specimens. Actually,
results at
−
40°C agree better than shown in Figs. 20 and 21. The discrepancy at higher
temperatures is more significant.
The final result is that both types of small-scale fracture mechanics specimens are
useful for assessing fracture toughness if fracture toughness is extremely low, i.e. when-
ever embrittlement caused by welding finds expression in a very low fracture toughness
of the HAZ.
6. FATIGUE PROPERTIES OF SIMULATED MATERIAL
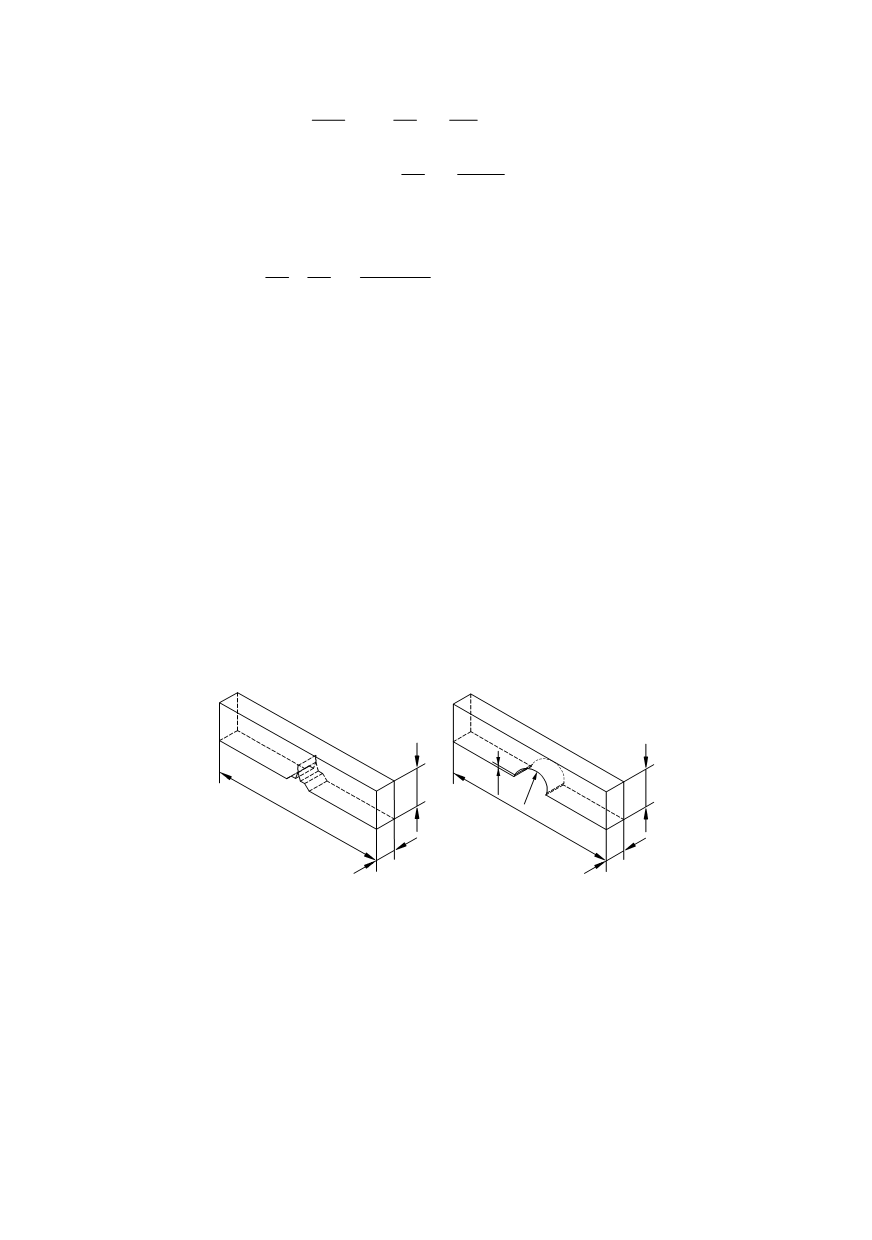
Two types of specimens were used to determine some fatigue properties of simulated
microstructure found in HAZ of welded joints. They are shown in Fig. 22
.
Simulated microstructure exists at the mid-length of the samples. The appropriate
shape of specimens and the type of loading must be taken into consideration. Strength of
HAZ can be higher than the strength of the base metal. In general, fatigue properties
increase with strength. Relevant fatigue properties will be available only if the fatigue
process takes place in the mid-length of the specimen.
70
368
8
14,5
0,2
R3
70
15
8
Figure 22. The appropriate specimen for measurement of fatigue crack propagation
rate (left), and for the endurance limit (right) in HAZ
,
∆
K
, is shown in Fig. 23–left [13].
ther smooth or weakened with Vickers indentations. They actually modelled
surface defects, of the size comparable with the size of grains in CGHAZ. An example of
the endurance limit,
∆
σ
eBn
, against the cooling time,
∆
t
8/5
, is shown in Fig. 23–right [13].
Single-edged specimens were used to determine fatigue crack propagation rate in the
materials of simulated microstructure. Specimens were loaded in pure bending on reso-
nant loading machine. The obtained propagation rate,
da
/
dN
, determined for two different
CGHAZs vs. stress intensity range
A notch 3.2 mm deep with radius
R
= 3.0 mm causes stress concentration with factor
K
t
= 1.74 [24,25], the level encountered in real welds [26]. The notched specimens were
used for experimental determination of endurance limit. Surfaces at the bottom of the
notch were ei