


 366 / 392

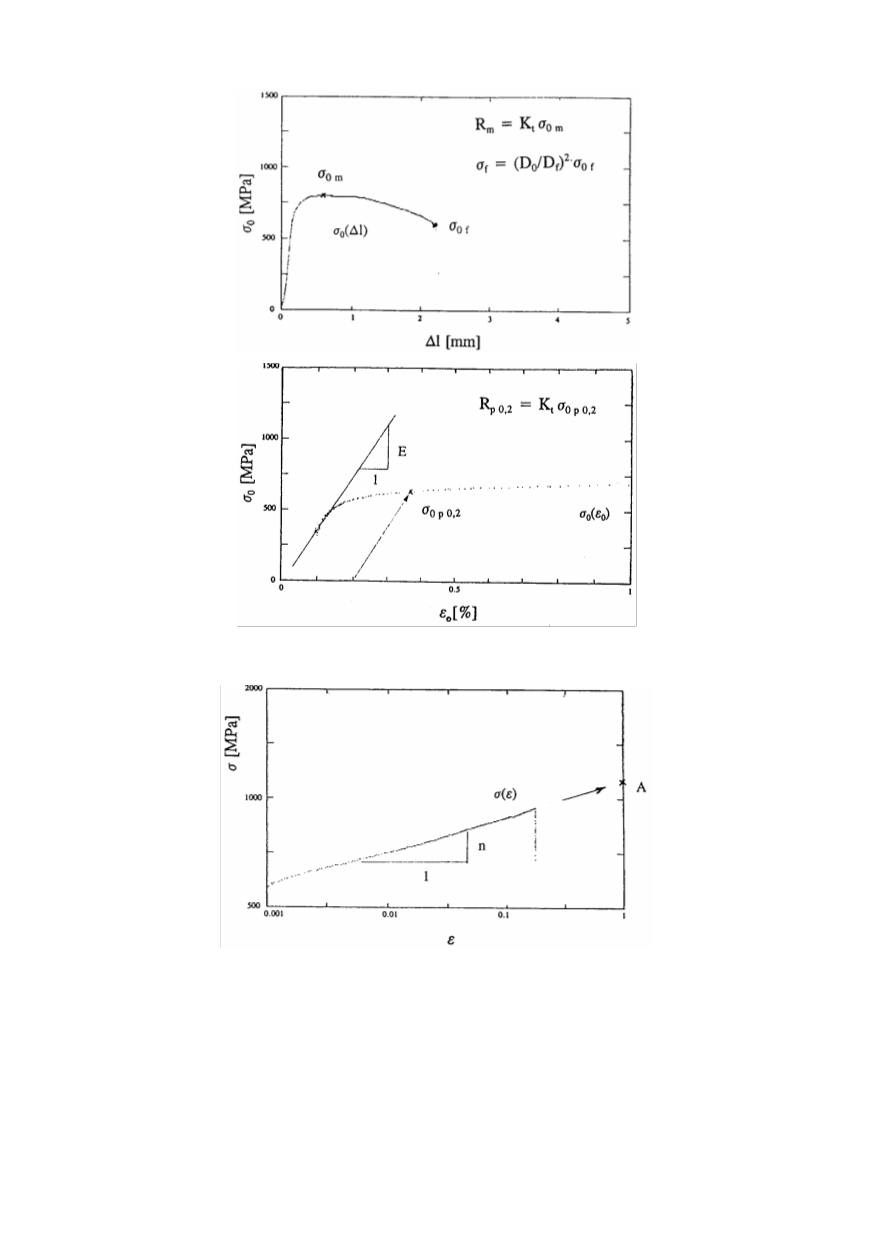
Figure 12. Engineering stress
σ
0
versus load-line displacement
∆
l
diagram (top), and
engineering stress
σ
0
versus engineering strain
ε
0
diagram (bottom)
Figure 13. Logarithmic dependence true stress–true strain for determination
of strength coefficient
A
and plastic strain exponent
n
5. FRACTURE PROPERTIES OF SIMULATED MATERIAL
Two types of precracked small-scale fracture toughness specimens were used to deter-
mine fracture properties of simulated microstructures that can be found in welded joints:
round tensile and three-point-bend specimens, presented in Fig. 14.
The reachable size of specimen actually depends on the heating and cooling capacity
of the used simulator. Therefore, specimens made from samples with simulated micro-
362