


 364 / 392

4. MECHANICAL PROPERTIES OF SIMULATED MATERIAL
Hardness of the simulated microstructure is not difficult to measure. Actual hardness
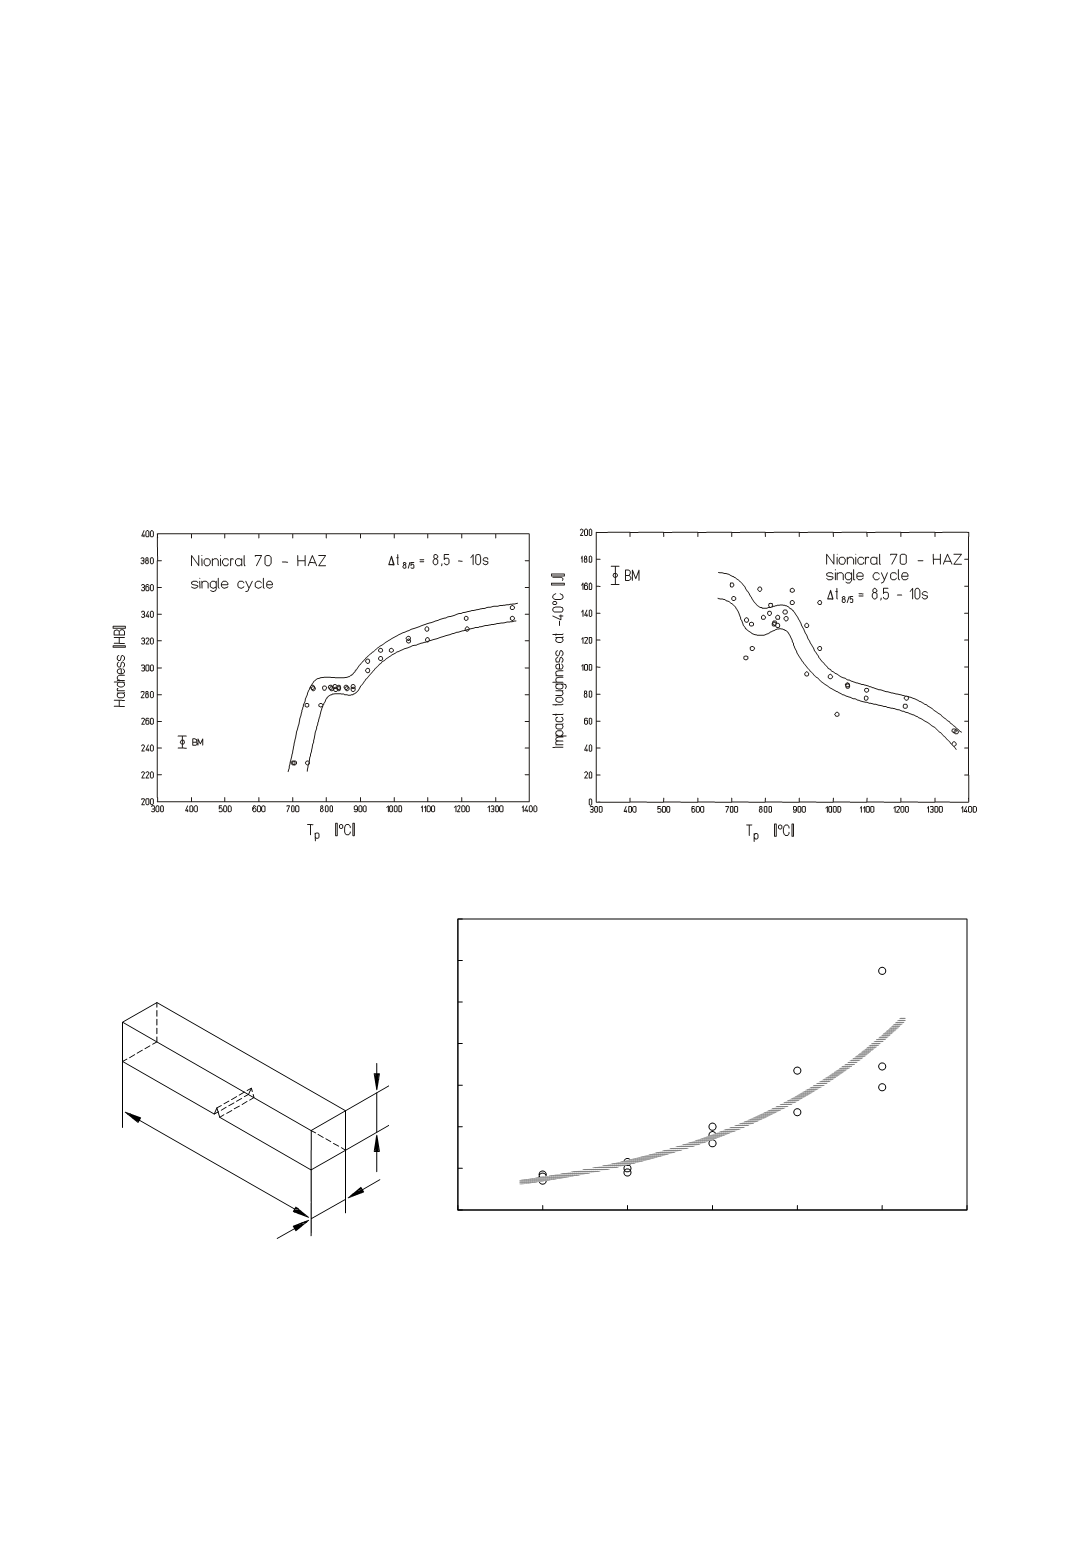
data are available from real welded joints, too. Brinell hardness of a single cycle HAZ for
HSLA steel Ninonicral 70 is shown in Fig. 8–left [13]. Peak temperature,
T
p
≅
700°C
represents
Ac
1
temperature of the steel, whereas
T
p
approaching 1400°C represents the
zone close to the fusion line. The hardest is the CGHAZ. Impact toughness of the same
HAZ as that in Fig. 8–left, is shown in Fig. 8–right [13]. The hardest zone of HAZ, i.e.
the CGHAZ, has the lowest toughness.
It is an easy task to determine impact toughness on simulated microstructures. Size of
the sample is so defined that standard Charpy specimens can be machined. The region
with the simulated microstructure is a few millimetres long and located in the middle of
the sample, and the V-notch can be positioned at this point (Fig. 9–left). As an example,
Charpy impact toughness vs. temperature (S curve) for the simulated microstructure of a
CGHAZ of HSLA Nionicral 70 steel [15] is shown in Fig. 9–right.
Figure 8. Hardness HB (left) and V notch Charpy impact toughness at –40°C (right) for
specimens, simulated at different temperatures
T
p
, meaning across the whole width of the HAZ
360
10
55
10
0
20
40
60
80
100
120
140
-40
-20
0
20
40
60
8
T [° C]
Impact toughness [J]
0
peak temperature of subsequent thermal cycle, as shown by an example for the same
steel, in Fig. 10–right [13].
Figure 9. Charpy specimen machined from the sample with simulated microstructure
of the CGHAZ (left), and its S-curve (right)
The relation between impact toughness and cooling rate can be studied as shown in
Fig. 10–left for HSLA Nionicral 70 steel, and the relation between impact toughness and