


 367 / 392

363
structure of the appropriate sub-zone of the weld are hardly large enough for standard
testing of fracture toughness
K
I
c
[16,17].
Only provisional fracture toughness values are available when specimens do not fulfill
the size criteria in standards which depend on fracture and mechanical properties of the
tested material. The only exceptions are the extremely brittle sub-zones of welded joints.
Otherwise, adequate methods should be introduced to evaluate either the provisional
fracture toughness data or original experimental diagrams. These approaches are of great-
est interest because just the most brittle sub-zones are decisive for the integrity of the
whole welded structure.
When simulation is performed, the prepared microstructure exists only at the mid-
length of the samples. The crack should be positioned there. Besides, fracture toughness
should not be influenced by crack preparation.
The ro
hine pre-
notched to 1.5 mm i
AZ. The specimens
2.5 mm deep ring-
R
= –1 was applied.
Th
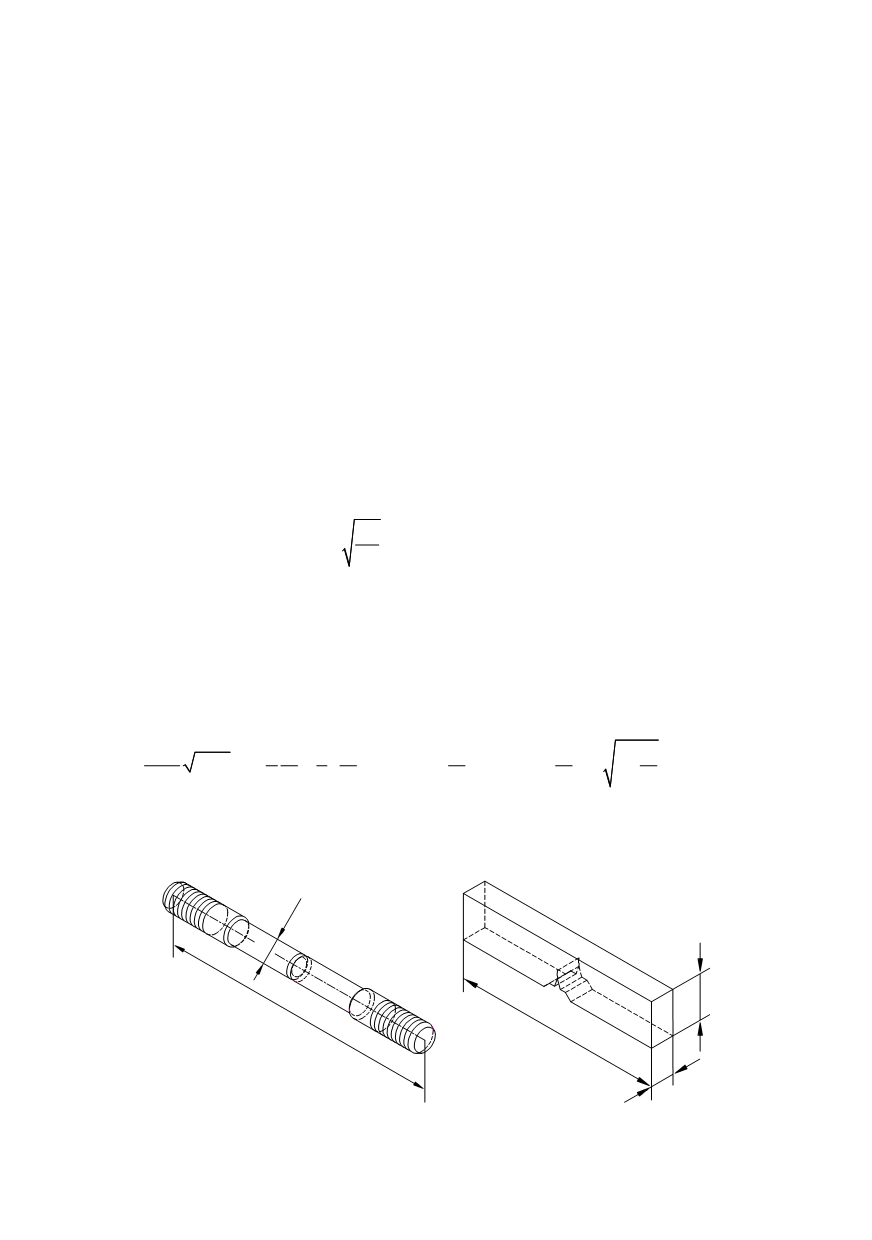
und tensile specimens
φ
10×120 mm (Fig. 14–left) were circularly mac
n the region of the simulated microstructure of H
were loaded by rotational bending to produce approximately 2 to
shaped fatigue pre-cracks. Minimum to maximum cycle loading ratio
e maximum stress intensity factor,
K
max
, was kept below 70% of the minimum
expected
K
I
c
[18], which could be measured using a specimen with
D
= 10 mm.
K
max
was
established as:
max
I
0.7
0.7
0.0572
1.5
app
app
c
p
p
D
K
K
R
R
=
=
×
=
×
(5)
The approximate yield strength,
R
p
app
, was determined from hardness data using
formulas from [17]. The
R
p
app
and
K
max
values in Eq. (5) are expressed in MPa and in
MPa·m
1/2
, respectively. The final proportion of the net-to-gross diameter of the specimen
was 0.5 to 0.6.
Tensile specimens were loaded up to fracture. If diameter
D
fulfilled the condition
given in [18], plane-strain fracture toughness,
K
I
c
, would be expressed by using the
following relation:
2
3
4
I
2
3
2 1
0.363
0.731
1
2 8
1
F
d
d
d
d
d
d
K
D D
D
D
D
d
π
π
⎛ ⎞
⎛ ⎞
⎛ ⎞
=
+ +
−
+
−
⎢
⎥
⎜ ⎟
⎜ ⎟
⎜ ⎟
⎝ ⎠
⎝ ⎠
⎝ ⎠
⎢
⎥
⎣
⎦
(6)
Two different
F
–
LLD
(
∆
l
) diagrams recorde
⎡
⎤
d by fracture toughness testing are shown
in Fig. 15 [19]. The left one is linear and enables direct
K
I
c
determination, whilst the right
one is not valid for
K
I
c
determination, according to standards.
120
φ
10
70
8
Figure 14
15
. Round tensile specimen (left), and three-point-bend specimen (right)