


 373 / 392

10
-6
369
∆Κ
[MPa m ]
1/2
10
-10
40
20
10
2
10
-9
∆
K
th
da/dN [m/cycle]
10
-8
10
-7
350
400
450
500
550
BM
HAZ
∆σ
eBn
[MPa]
∆
t
8/5
[s]
100
50
10
5
smooth
serious of
indentations
single
indentations
Figu
efects were calcu-
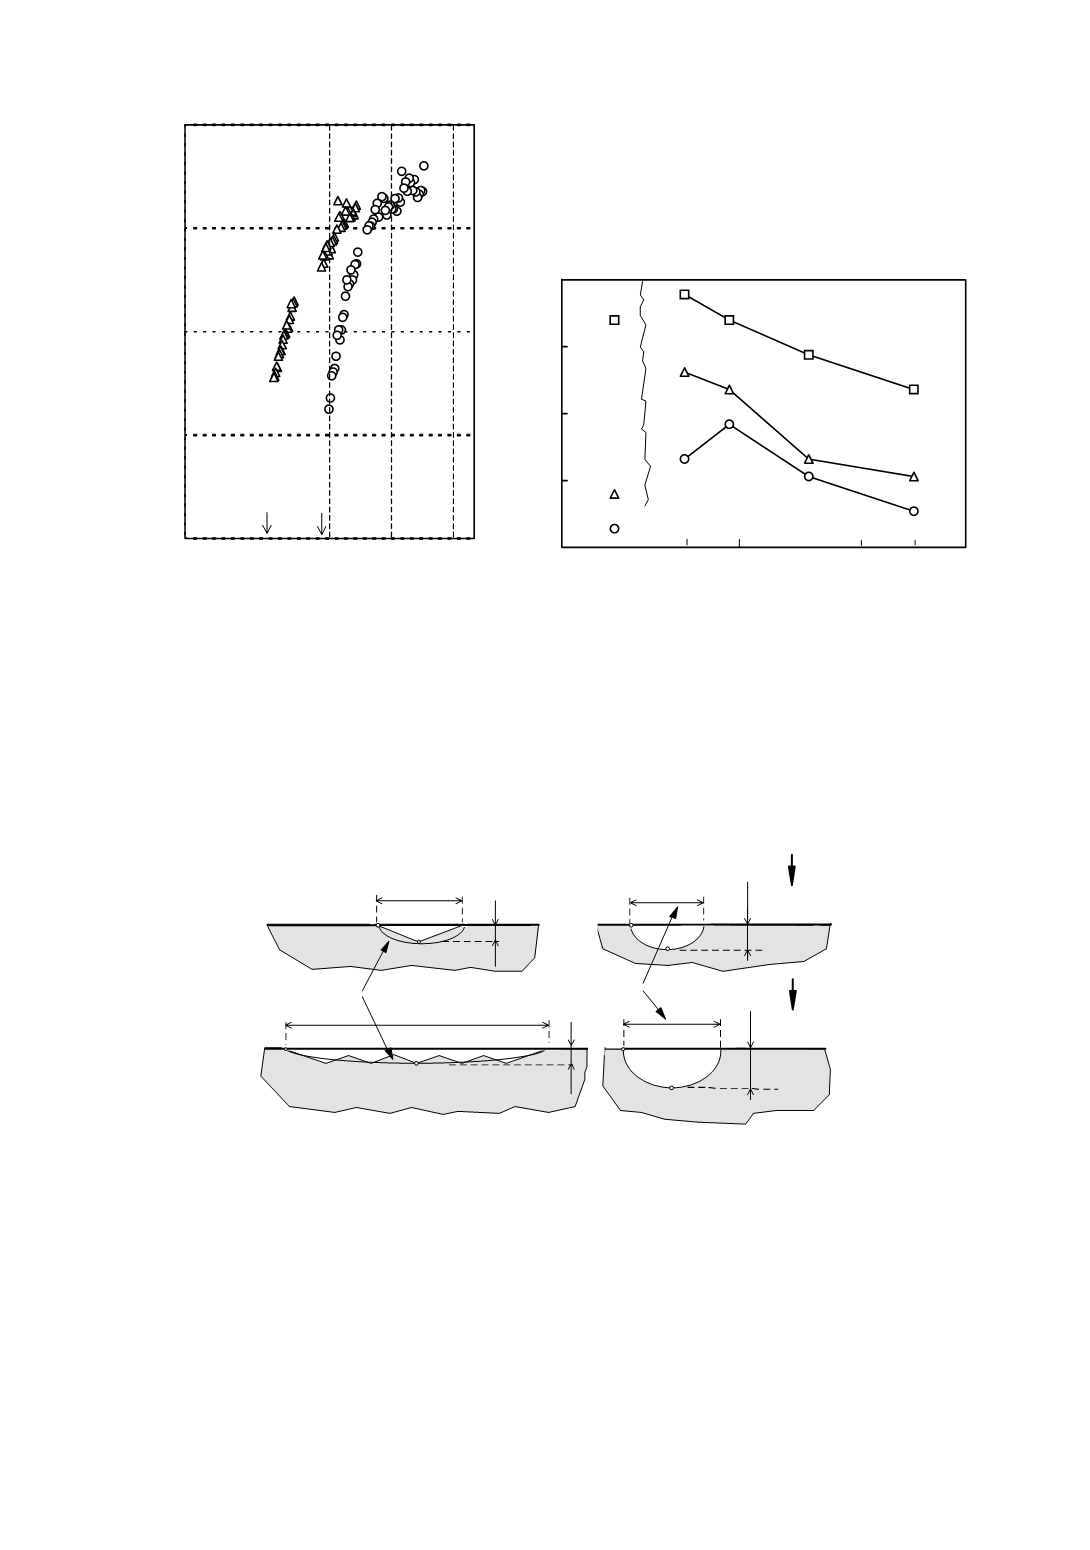
re 23. The fatigue crack propagation rate (left), and three courses of the endurance limit
Two types of surface defects were considered: single Vickers indentations and series
of Vickers indentations. The size of each indentation was either
d
≅
110
µ
m or
d
≅
220
µ
m. Both kinds of artificial defects are schematically presented in Fig. 24–left
[27,28]. Equivalent geometrical parameters (EGP) of these artificial d
lated. Defect size and stress gradient were also taken into account [13]. They are shown in
Fig. 24–right.
2c=l
b
b
2,20
x
b
B
A
A
B
A
A
B
B
EGP
1,67
x
b
2,42
x
EGP
2c=d
eq. crack
Figure 24. Single (upper left) and series of Vickers indentations (left down) used as
artificial surface micro-defects and appropriate designed equivalent geometrical
parameters (EGP) that describe the effect of defects on fatigue strength (right)
Experimentally determined fatigue strength, i.e. endurance limit of materials, of
twelve different structures found in HAZ, from both single cycle CGHAZs and double
cycle HAZs that initially, after the first cycle were CGHAZs, are presented in Fig. 25
[13,28] in double logarithmic coordinates. Endurance limit of simulated HAZ with the
sizes of defects at the right side of the diagram resembles the influence of long cracks.
The slopes approach one half, which is typical for linear elastic fracture mechanics.
In order to consider the significance of material strength for fatigue behaviour, the
threshold stress intensity factor range is normalised with the strength of the material.