


 371 / 392

367
0
50
100
150
m
200
1/2
]
250
-100
-50
0
50
100
T [°C]
K
EE
[MPa
CGHAZ
30
0
0
0
0
0
tensile spec.
bend spec.
0
-100
-50
0
50
100
T [°C]
ICCGHAZ
30
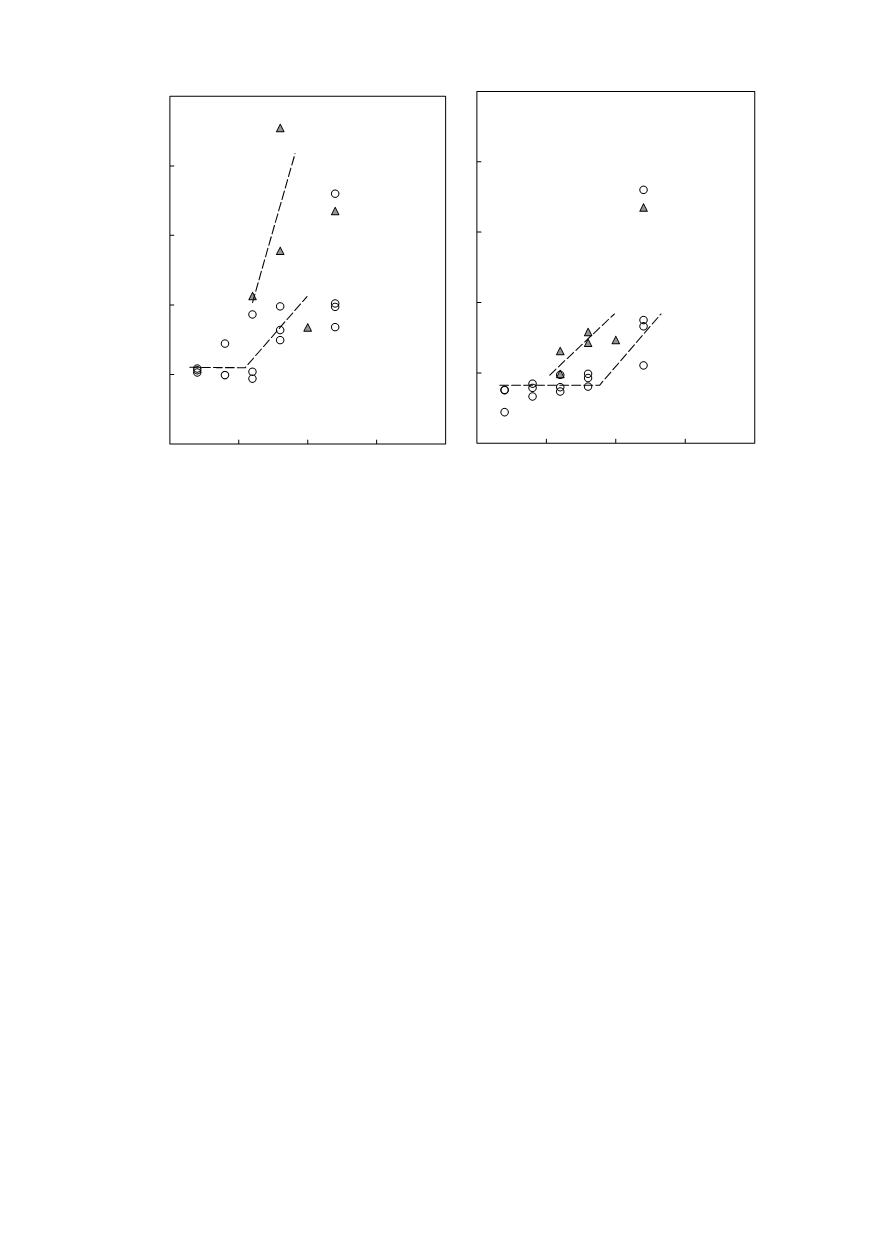
Figure 21. Approximate fracture toughness values
K
EE
of CGHAZ
30
and ICCGHAZ
30
The
K
EE
values of both ICCGHAZs agree fairly well across the whole temperature
range of CTOD testing (–40 to 0°C). The agreement between
K
EE
values of both
CGHAZs is acceptable only at
−
40°C, but not at higher temperatures. However, values in
Figs. 20 and 21, which are derived from diagrams recorded by CTOD testing, are in
general, in spite of adaptation, less optimistic than the others. The reason is the character-
istic geometry of both fracture toughness specimens.
Experimental fracture toughness results are always influenced by plastic zone size,
irresp
diagrams, the developed plastic zone size is limited and the influence is almost negligible.
Nevertheless, the effect of the same size of plastic zone is higher on tensile specimens
than on three-point bend specimens. The reason is the actual size and the peculiarity of
circular cross-sections in comparison with rectangular ones. The size of the net cross-
section of both specimens depends on the size of the pieces of steel that can be prepared
on simulators and on the specimens’ shape.
When a limited, but not a negligible, plastic zone is developed, another approach is
available for the evaluation of material fracture toughness; this is known as plastic zone
correction method [23]. The plastic zone size assessed at the moment of fracture is added
to the actual crack length. A more realistic fracture toughness is calculated according to
the usual formulae. By using a crack length correction, the specimen cross-section is ficti-
tiously reduced.
An increase in crack length changes the specimen cross-section. The consequence of
the plastic zone development results in a reduction of net diameter,
d
, of tensile speci-
mens with a round cross-section, and of the net width (ligament),
W
−
a
, of specimens
with a rectangular cross-section. The increase in crack length is approximated simply
with the plastic zone size,
r
y
, since
r
y
<<
d
and
r
y
<<
W
−
a
. However, the relative cross-
section reduction for both types of specimens is not the same, despite the same plastic-
zone size and the same stress state. The expression for round tensile specimens is shown
in Eq.
tensile spec.
bend spec.
ective of the degree of non-linearity of
F–LLD
diagrams. In case of perfectly linear
(10) whereas for three-point-bend specimens in Eq. (11).