


 361 / 392

heating by welding are in this way much more clear and more stressed. The consequence
of such a weld thermal cycle simulation in the limited length of the specimen mid-part is
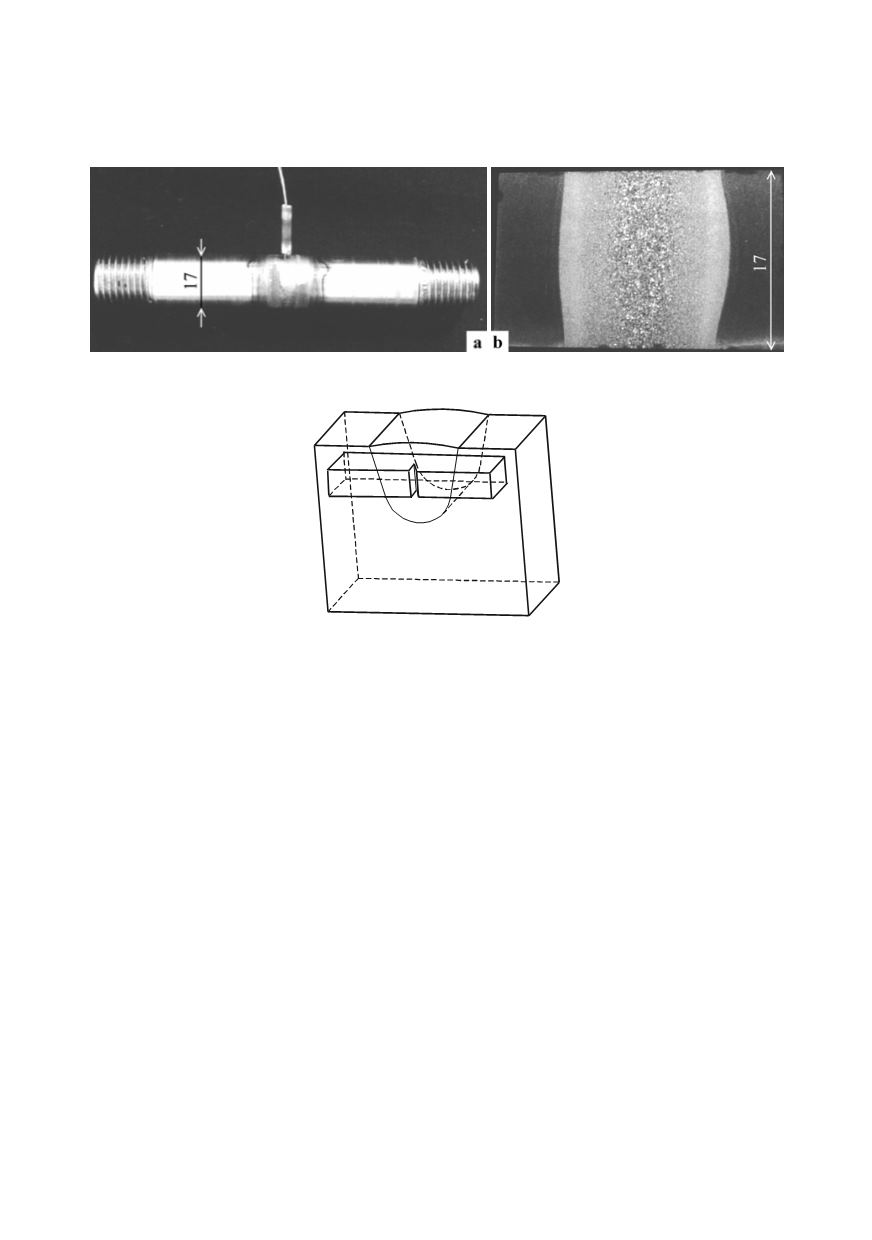
a uniform microstructure over the whole cross-section of the sample (Fig. 3b [11]).
Figure 3. Sample with a simulated microstructure of HAZ (a).
Macrograph made in the middle of the sample (b).
Figure 4. Sample with the starting microstructure of the weld metal
Two examples of welding simulation performed on thermal cycle simulator are shown
in Fig. 5. Both diagrams show thermal conditions close to the fusion line, where during
welding the temperature attained almost melting point of the steel Nionicral 70 at least
once. The
T
p
exceeded 1350°C during single thermal cycle. Coarse grain HAZ is formed
(CGHAZ). During the double thermal influence, the
T
p
1
exceeded 1350°C too, but then
the
T
p
2
(peak temperature of the subsequent weld pass) attained the temperature range in-
between
Ac
1
and
Ac
3
temperatures (780°C). Dilatometric curves are recorded. Their
analysis show at which temperatures austenite begins to decompose (indexes
s
) and at
which temperature the decomposition is finished (indexes
f
). In Fig. 5,
M
means marten-
site, whilst
B
means bainite.
Continuous-cooling-transformation
diagrams represent the microstructure that will
form during welding at different distances from the fusion line at different cooling rates.
Chemical composition and peak temperatures are already taken into account.
An example of CCT diagrams in the region of the coarsest grain is shown in Fig. 6 for
two different steels: HSLA steel Nionicral 70, and StE 355 Ti, fine-grained steel, micro-
alloyed with Ti. The first CCT diagram is taken from Ref. [13] whilst the second one from
Ref. [14]. Both diagrams are valid under welding conditions for CGHAZ, since the
temperature of thermal cycles exceeded at least 1350°C, and cooling corresponds to real
welding. Such a thermal cycle is shown in the upper diagram in Fig. 5.
The microstructure of CGHAZ at higher cooling rates (shorter
∆
t
8/5
) in Nionicral 70 is
martensitic (Fig. 6–left). At medium rates the bainitic-martensitic microstructure is found in
the CGHAZ. As longer is
∆
t
8/5
, the proportion of bainite in CGHAZ is greater. At very slow
357