


 323 / 392

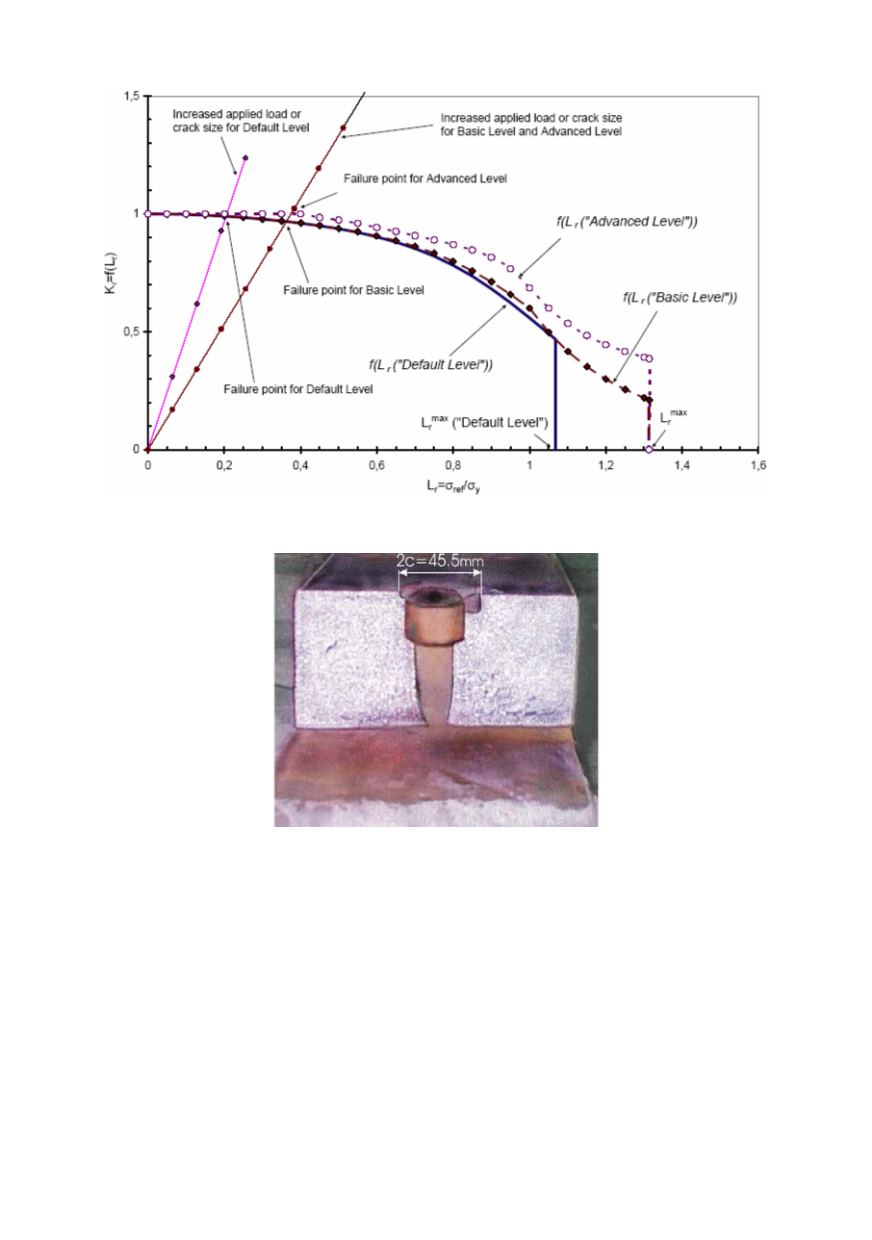
Figure 21. FAD analysis of the fork assuming a crack width of 2
c
= 45.5 mm. The predicted
failure loads are identical to those obtained by the CDF analysis in Fig. 20
22. Real crack length measurement of the fractured
319
Figure
fork
According to Fig. 3 the analysis was repeated for stepwise increased crack sizes 2
c
.
Critical crack size was then determined as the value of 2
c
that caused failure at half the
nominal applied load the forklift was designed for. The bi-section was necessary because
the forklift contained two forks.
As the final result, the critical crack size was determined to be:
•
2
•
2
c
= 33.2
•
2
c
= 35.6 mm (Advanced Level analysis).
Compared to the real overall surface dimension of edge cracks, 45.5 mm, at failure
(Fig. 22), the predictions were conservative by:
•
77.28% (Default Level analysis)
•
27.03% (Basic Level analysis)
•
21.75% (Advanced Level analysis),
c
= 10.35 mm (Default Level analysis)
mm (Basic Level analysis)