


 319 / 392

ln(1 )
t
ε
ε
= +
and
(1 )
t
σ
σ
ε
= +
(23)
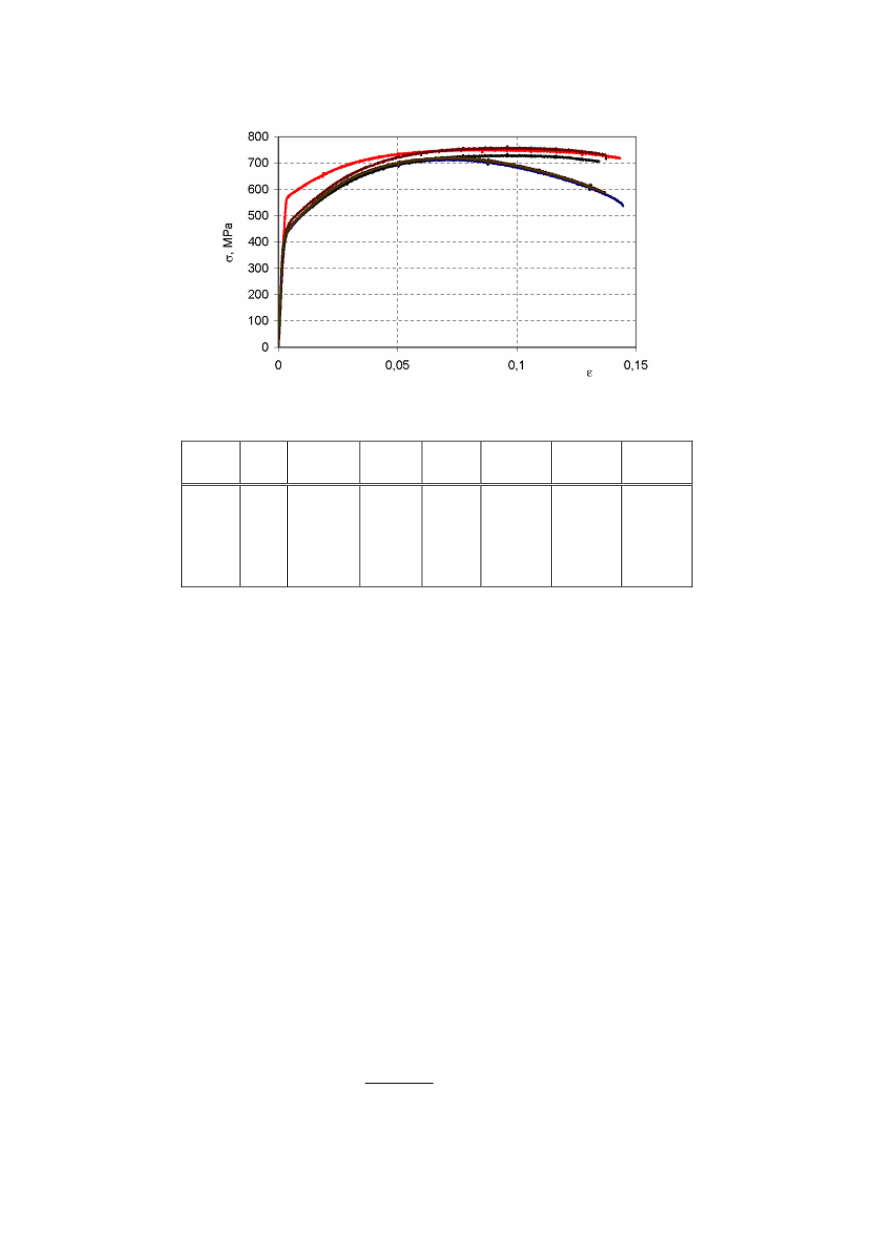
Figure 15. Engineering stress–strain curves of the fork material
Table 1. Mechanical properties obtained by tensile test and Charpy impact toughness values
E
GPa
ν
–
R
p
0.2
MPa
R
m
MPa
A
g
%
A
t
%
Z
%
N
–
2.1
0.3
446
448
578
474
440
720
735
754
764
716
6.89
8.89
7,.52
9.72
6.74
14.95
18.19
20.95
19.48
14.45
53.60
53.77
59.05
55.81
52.59
0.176
0.192
0.125
0.187
0.195
1.9. CDF versus FAD analyses
An important feature of the procedure is that the analyses can alternatively be based
on a Failure Assessment Diagram (FAD) or on a Crack Driving Force (CDF) philosophy.
Applying the FAD philosophy, a failure line is constructed by normalising the crack tip
loading by the material’s fracture resistance. The assessment of the component is then
based on the relative location of a geometry dependent assessment point with respect to
this failure line. In the simplest application the component is regarded as safe as long as
the assessment point lies within the area enclosed by the failure line. It is potentially
unsafe if it is located on or above the failure line. In contrast to this, in the CDF route the
crack tip loading in the component is determined in a separate step. It is then compared
with the fracture resistance of the material. If the crack tip loading is less than the fracture
resistance, the component is safe, otherwise it is potentially unsafe.
Basic equations of FAD and CDF routes are set out in sub-sections 1.9.1 and 1.9.2 below.
1.9.1. FAD route
In the FAD route (Fig. 16), a failure assessment curve (FAC),
K
r
vs.
L
r
, is described
by the equation
( )
r
r
K f L
=
(24)
To assess for crack initiation and growth, two parameters need to be calculated. The
first one,
K
r
, is defined by
315
I
( , )
r
mat
K a F
K
K
=
(25)
where
K
I
(
a
,
F
) is the linear-elastic stress intensity factor of the defective component and
K
mat
is the fracture toughness.