


 322 / 392

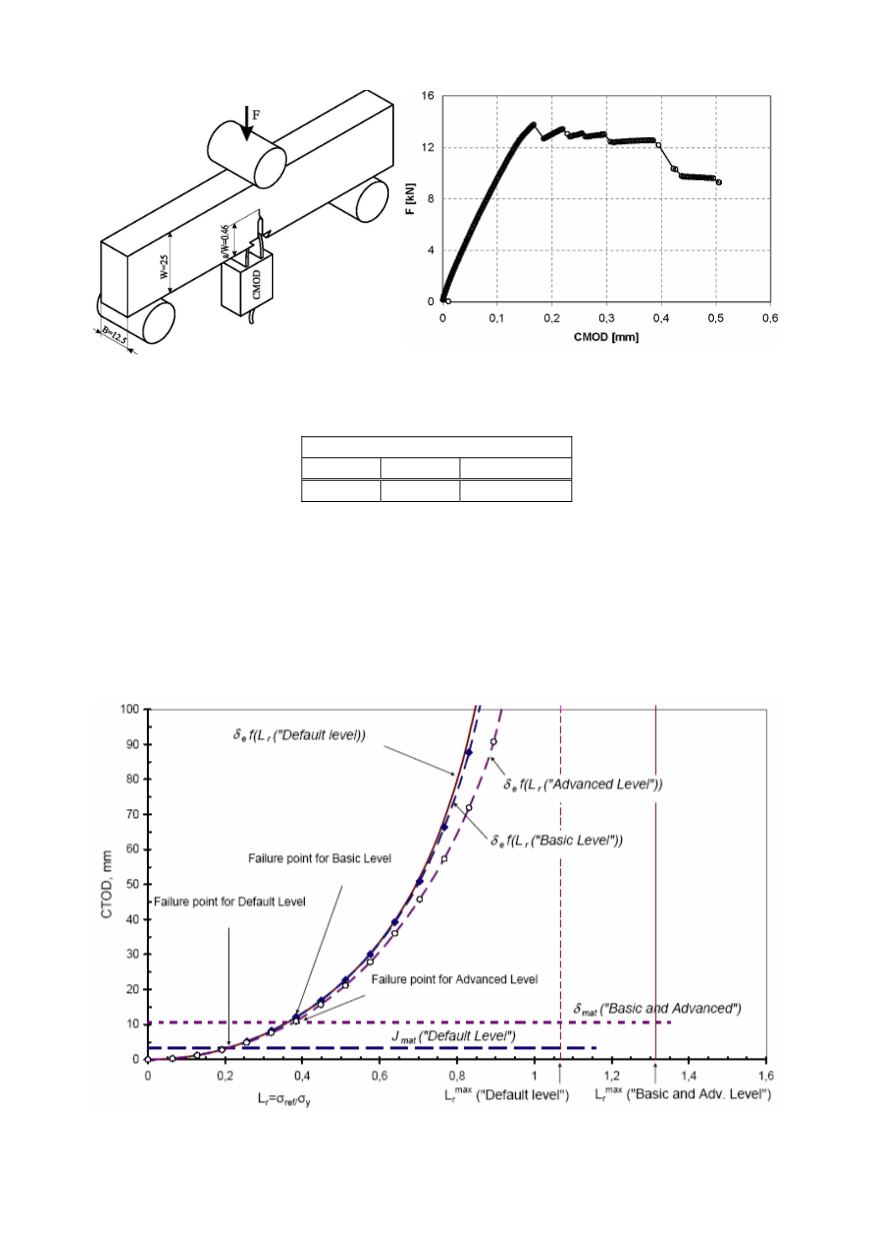
Figure 18. Test setup for determination of
critical crack tip opening displacement
Figure 19. Typical test record of a CTOD test
Table 2. Charpy energy of the fork material at different temperatures
Charpy impact toughness J/80 mm
2
+10°C
+20°C
+50°C
6; 6; 6
7; 6; 7
9; 8; 9
2. FAILURE
SSION
The fork of a forklift is an
el, level “1” and level “3”.
In Figs. 20 and 21 the CDF and FAD analyses
onstrated for a crack size of
2
c
= 45.5 mm. This length corresponds to real crack length measured on the fractured
22. It is shown that the higher analysis levels yield less
fro
ANALYSIS OF THE COMPONENT, RESULTS, AND DISCU
example for using “Default” lev
are dem
surface of fork, as shown in Fig.
conservative results. The Default Level which uses fracture toughness values estimated
m Charpy energy gives much lower critical loads than the higher levels.
318
Figure 20. CDF analysis of Fork assuming a crack width of 2
c
= 45.5 mm. Failure is predicted for
an applied load of 15 kN (Default Level), 27.38 kN (Basic Level), and 29.9 kN (Advanced Level)