


 380 / 392

2.2 Failure analysis diagram
Structures made of ductile materials are less susceptible to brittle fracture, and there-
fore may fracture by plastic collapse. The mechanism of plastic collapse is not covered by
designed CTOD curve, so its analysis requires a more general, two-parameter approach,
realized through the Failure Analysis Diagram (FAD). This diagram represents the
boundary curve, constructed according to the modified model of a yielding track for a
passing-through crack on an infinite plate,
[
18
]
:
1 2
2
I
8 ln sec
2
eff
c
c
K
K
σ
π σ
σ
σ
π
⎡
⎤
=
⎢
⎥
⎣
⎦
(4)
where
K
I
=
σ√π
a
,
K
eff
was introduced instead of
δ
(
K
eff
2
=
δσ
Y
E
), and yield stress
σ
Y
was
replaced by plastic collapse stress
σ
c
as a more convenient yield criterion for actual struc-
tures. As a final step, non-dimensional variables
S
r
=
σ
/
σ
c
and
K
r
=
K
I
/K
I
c
are defined,
where it is supposed that
K
eff
equals to the fracture toughness of the material, so that
Eq. (4) becomes:
1 2
2
8 ln sec
2
r
r
r
K S
S
π
π
−
⎡
⎤
⎛
⎞
=
⎜
⎟
⎢
⎥
⎝
⎠
⎣
⎦
(5)
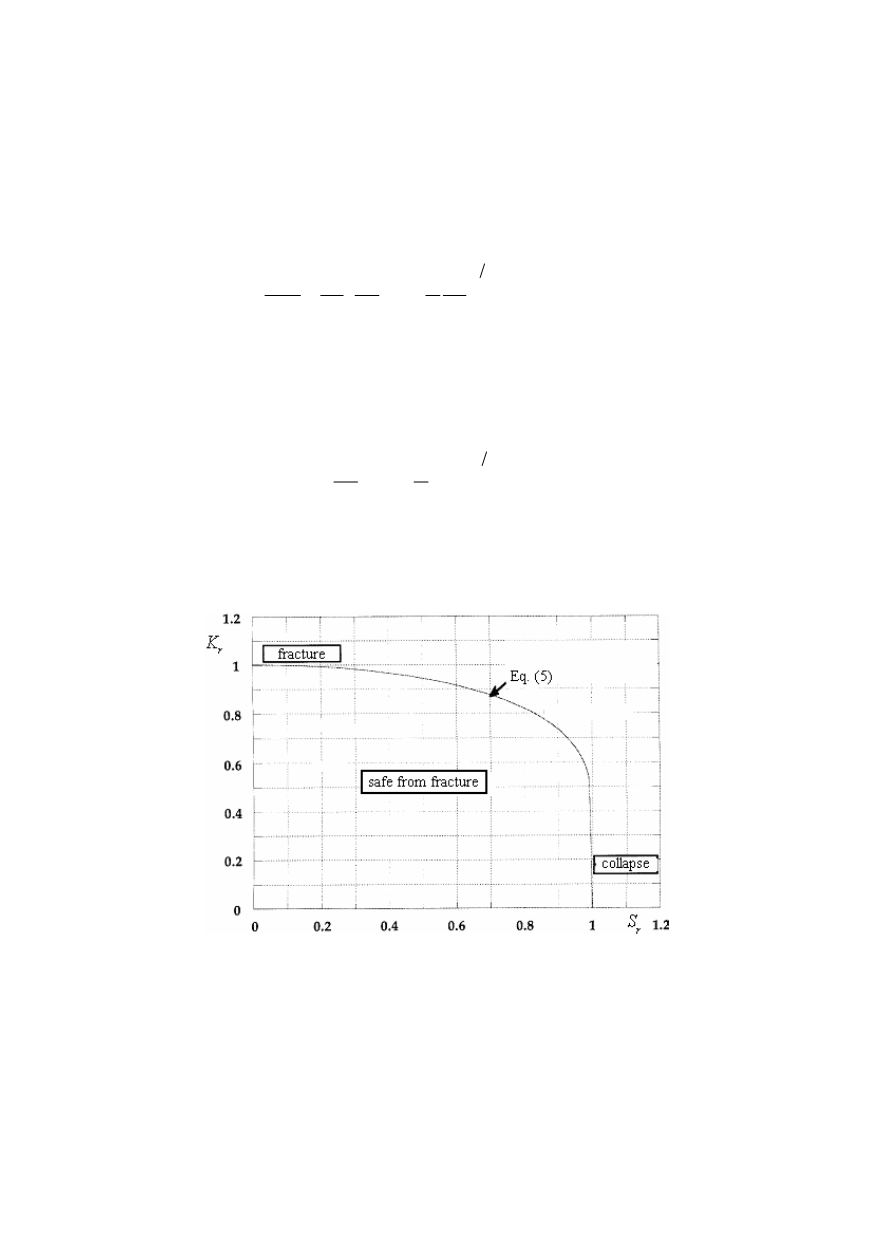
If the material is completely ductile, the structure fails due to plastic collapse at
S
r
= 1,
while for fracture of a completely brittle material
K
r
= 1. In all other cases there is an
interaction between plastic collapse and brittle fracture, so that
K
r
and
S
r
are less than 1,
and the pairs of corresponding values make a boundary curve, Fig. 3.
Figure 3. Failure analysis diagram
Stresses necessary for determination of
K
r
and
S
r
are divided as on the design CTOD
curve, into primary and secondary ones, and in determining
S
r
only the primary stresses
are taken into account, as the secondary stresses do not affect structural collapse.
It should be mentioned that the application of FAD is not limited to
K
, also
J
or
δ
can
be placed on the ordinate, as well as the numerous modifications of this diagram such as
‘level III’ expanding the zone of plastic yield collapse, or ‘level I’ which simplifies it, as
defined in Procedure 6493
[
20
]
.
376