


 338 / 392

nor the work stresses are determinant values. The determinant values are stochastic values
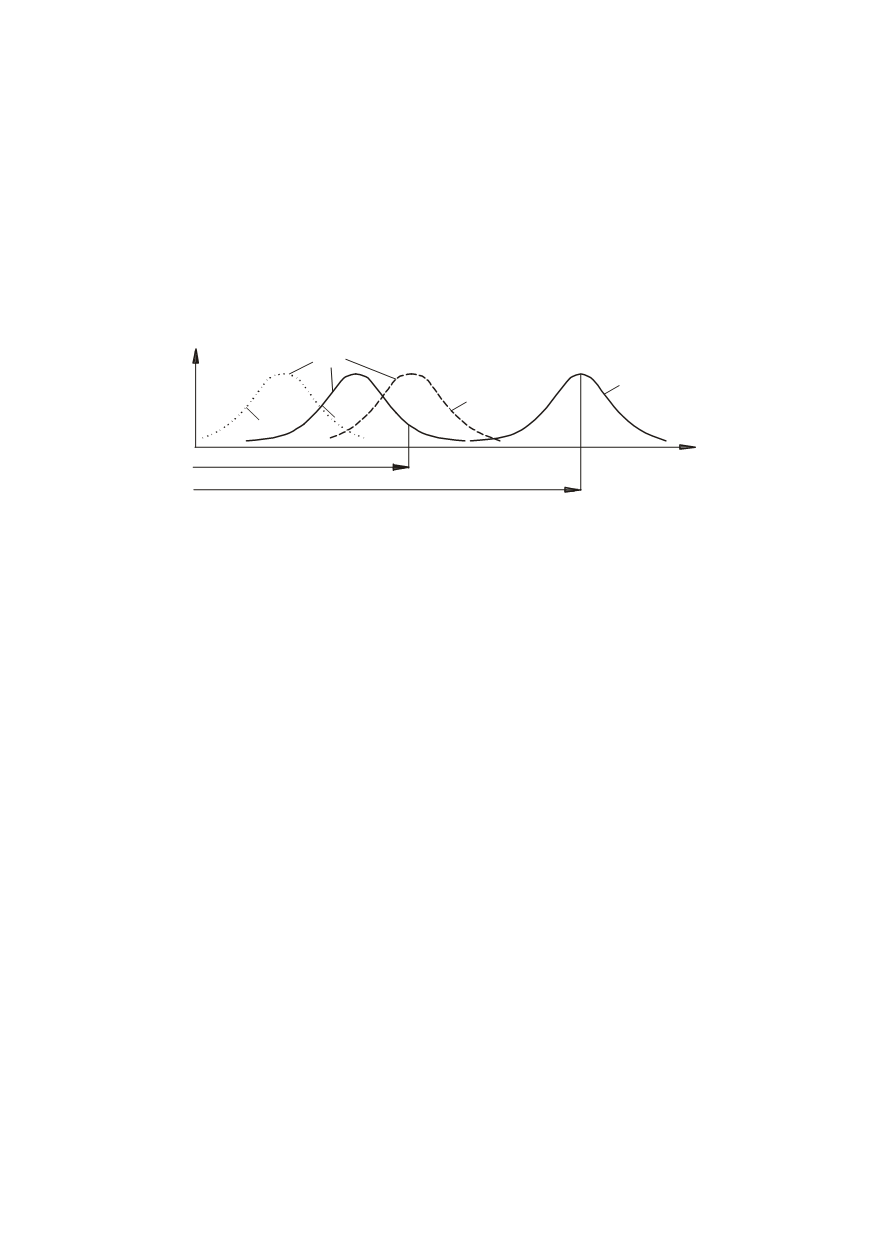
which dissipate by rule within a wide range (Fig. 1). The safety factor is the ratio of the
mean (most probable) value of critical stress and the highest work stress, which can be
expected in the work process. There is also a possibility for the occurrence of circum-
stances which cannot be foreseen, thus work stress can be somewhat greater, but this is
not likely. The machine part has absolutely been used, and the safety in work satisfied, if
the safety factor is such that the highest possible value of work stress is lower than the
minimal possible value of critical stress. This condition has been satisfied if the dissipa-
tion presented in Fig. 1 (curve 1) is covered by the value of the safety factor. This value is
S
= 1.25
…
2.5. Lower limits may be used when data about the critical and work stresses
are well known and reliable.
Stress
σ
3
2
1
[
σ
]
f(
σ
)
f([
σ
])
Probability
density
Figure 1. Relation between service stress distribution
f
(
σ
) and critical stress
distribution
f
([
σ
]) in safety factor determination
Large values of safety factor create conditions for work stress to be significantly
smaller than the critical one (curve 3 in Fig. 1). The increased distance between the
curves of the distribution of critical and work stress does not increase the probability that
failures will not occur. This probability is close to zero when these curves are close to
each other (the curve of work stress distribution 1). With increase in safety factor there is
an increase in dimensions, and the safety remains the same. High values of the safety
factor contribute to irrational use of mass of machine parts, and make the design solution
large and massive. In machine systems where mass reduction is of increased significance
for the materialization of the function, rationality is achieved by acting on all factors on
which the machine part mass depends, and thus also onto the safety factor. In these
machine systems it is not sufficient that the safety factor be on the lower limit which
provides the condition that there is no probability for failure to occur. A risk is taken that
in a smaller number of machine systems, some of which failed. After failures they are
replaced by new ones, and the risk taken enables the reduction of safety factor below the
indicated lower limits and reduction of dimensions, i.e. mass of chosen parts and the
entire machine system. The risk of failure is unreliability, and the probability for failure
not to occur in the course of service length is the reliability. Calculation on the basis of
limited risk that failure may still happen is a transition from the range of complete safety
into the range of reliability. The curves of work distribution (2) and critical stresses in
Fig. 1 overlap partly. The ends of these curves are with small (low) probability density
and overlap on the wide range of stress. The difference between critical and service stress
is thereby significantly reduced and dimensions decrease with a relatively small “risk” of
failure. The safety factor determined for the state of partial overlapping of curves of the
distribution of the working and critical stress is significantly smaller than the minimal
required for the provision of full safety. This contributes to significant mass reduction
according to the diagram in Fig. 1. This value of safety factor may be valid for orien-
tational determination of allowed stress for the reliability range. A more precise calcula-
334