


 340 / 392

The presented procedure enables cumulative probability
F
p
to be obtained for variable
stress amplitude, based on the function of distribution of failure probability
P
Ri
for
constant stress amplitude. This approach is acceptable for most defects of which it is
necessary to fulfil two conditions: that the cause of defect exists and that this cause is
capable of producing the defect. This means at the same time that functions presented in
Fig. 2 are mutually independent. In fractures due from fatigue, these two curves are not
independent. The position of the function of failure probability distribution
P
R
depends on
the shape of probability density
f
(
σ
) function. If the function
f
(
σ
) is asymmetrical so that
the density maximum centre is towards lower stress values, that is a light exploitation
regime. For light regimes the function
P
R
moves towards the zone of greater values of
critical stresses. The curves
f
(
σ
) and
P
R
become mutually distant for such work condi-
tions, and unreliability
F
p
is reduced. In case of heavy exploitation regimes, the process is
opposite. In order to take into consideration relation between distributions of service and
critical stresses, it is necessary to introduce into consideration the failure probability for
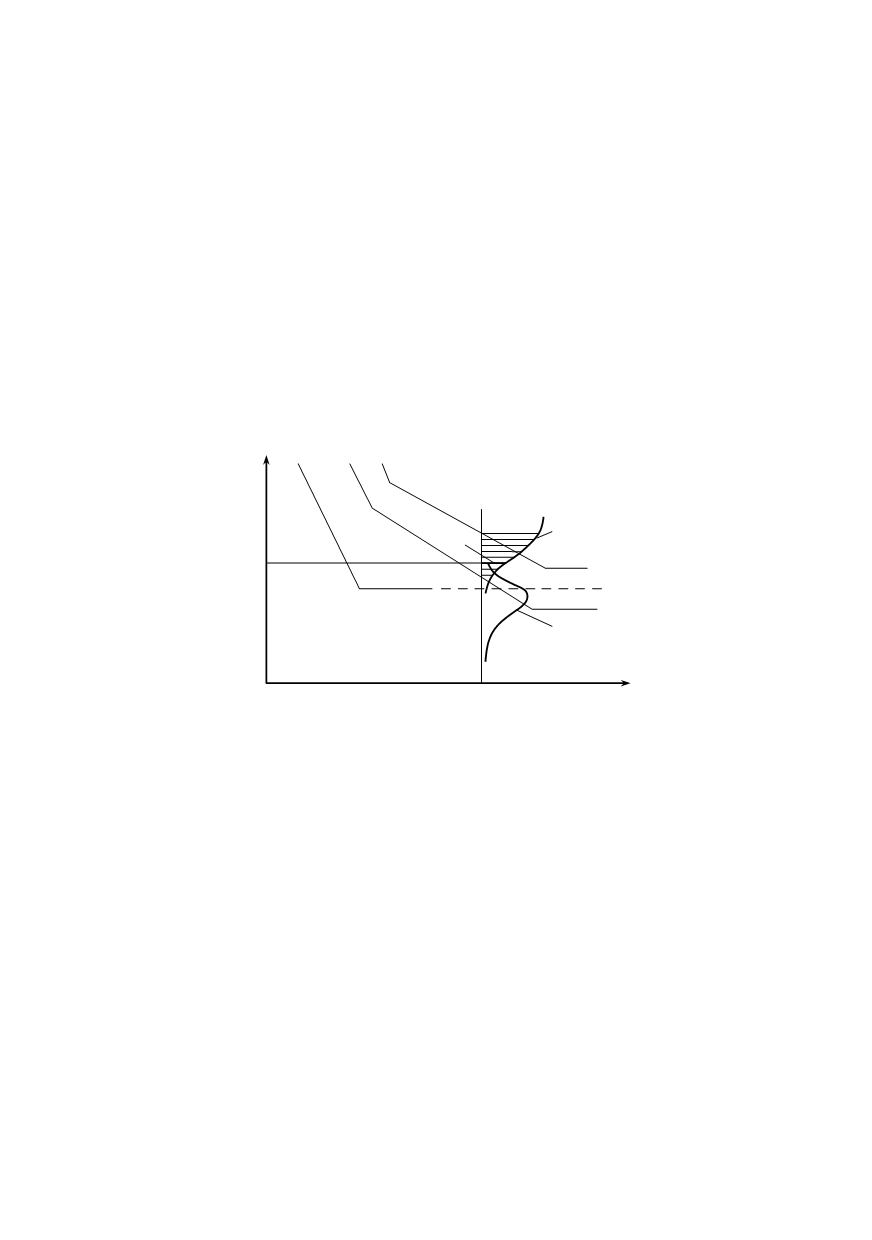
service fatigue strength. Figure 4 shows the function and the range of distribution of the
failure probability for the service fatigue strength.
N
R
σ
R
P
R
n
Σ
P
R
(
σ
1
)
f
(
σ
)
σ
1
Figure 4. The relation of stress distribution
f
(
σ
) and failure probability
P
R
for service fatigue strength
The service fatigue strength
σ
R
is the largest stress
σ
1
in the stress spectrum
f
(
σ
) which
leads to failure after
N
R
stress cycles of all amplitude values. Thus,
σ
R
is by nature the
greatest stress from the stress spectrum, marked by
σ
1
. The service fatigue strength may
be determined transforming the Wöhler’s curve by applying the damage accumulation
hypothesis or by experiments. The failure probability is determined for the respective
stress spectrum in which the largest stress is
σ
1
, thus for the given spectrum
f
(
σ
1
) = 1, and
the unreliability
F
p
=
P
R
(
σ
1
).
Starting from the fact that service and critical stresses must be treated as statistical
values, the possible approaches in the calculation of carrying capacity, safety factor, and
reliability are as follows. The least correct calculation is based on using the safety factor
as an indicator of the ratios of these stresses. It is expected that the safety be complete
thereby, and the dimensions are significantly greater in comparison to other ways of
calculation. A more precise approach with controlled risk is based on using indicators of
elementary reliability. In the fatigue of the machine parts to fracturing, distributions of
service and critical stresses are in mutual dependence. By introducing this effect also, the
calculation precision is additionally increased and the exploitation, i.e. unit carrying
capacity of machine parts is also increased.
336