


 334 / 392

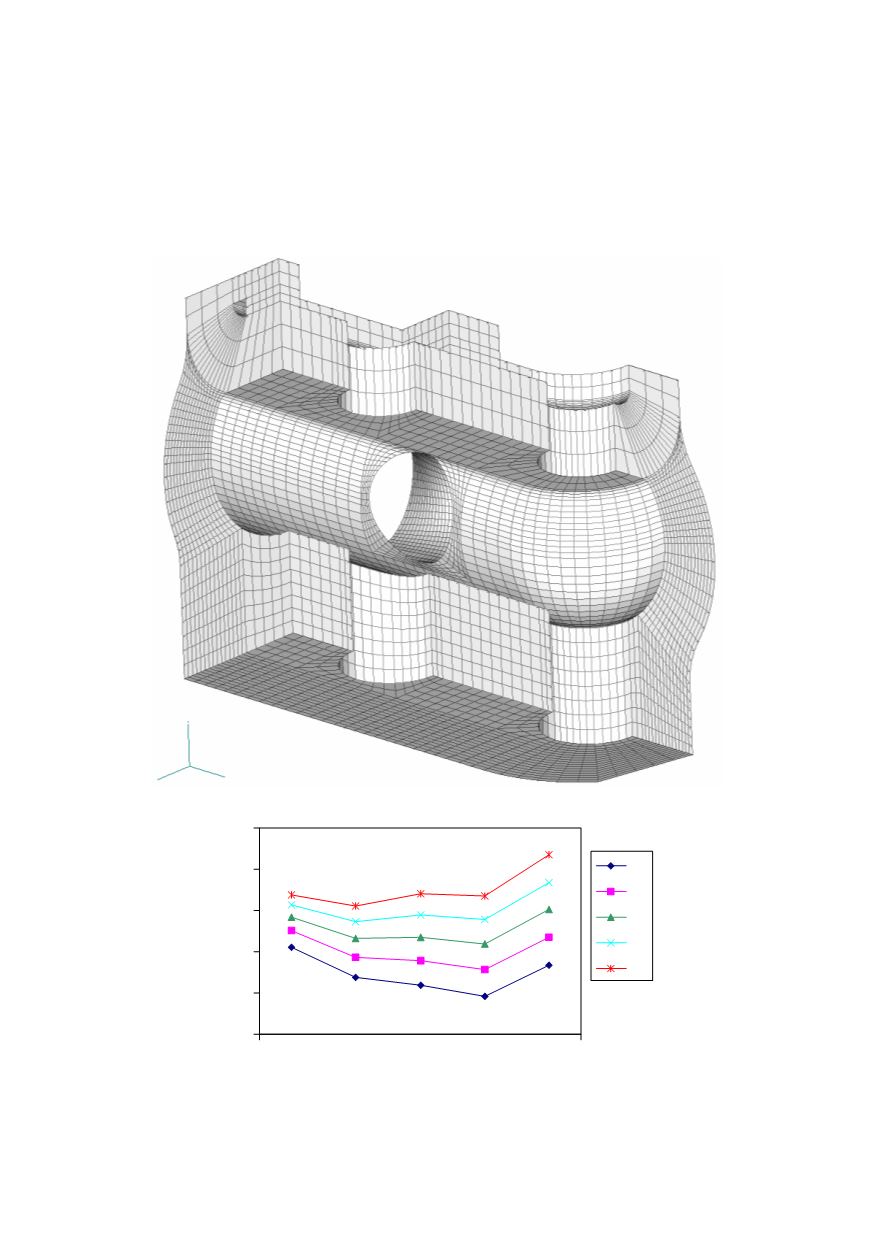
located in that quarter as well as the steam intake with sharp edges that induce the stress
concentration. In Fig. 9 the 3-D model is shown. The calculated relationship between
maximum effective stress and crack length for different crack depth is shown in Fig. 10.
It can be seen from Fig. 10 that variation in crack length from 90 mm to 375 mm, for
constant crack depth, did not significantly affect the effective stress. On the other hand,
increase of crack depth, for constant crack length, leads to a 15 to 30% increase in effec-
tive stress. Figure 11 shows the effective stress field in vicinity of the crack (375
×
30).
Figure 9. The 3-D model
70
80
90
100
110
120
90
150
225
300
375
20
25
30
35
40
Figure 10. Relationship between maximum effective stress and
crack length for different crack depth
330