


 331 / 392

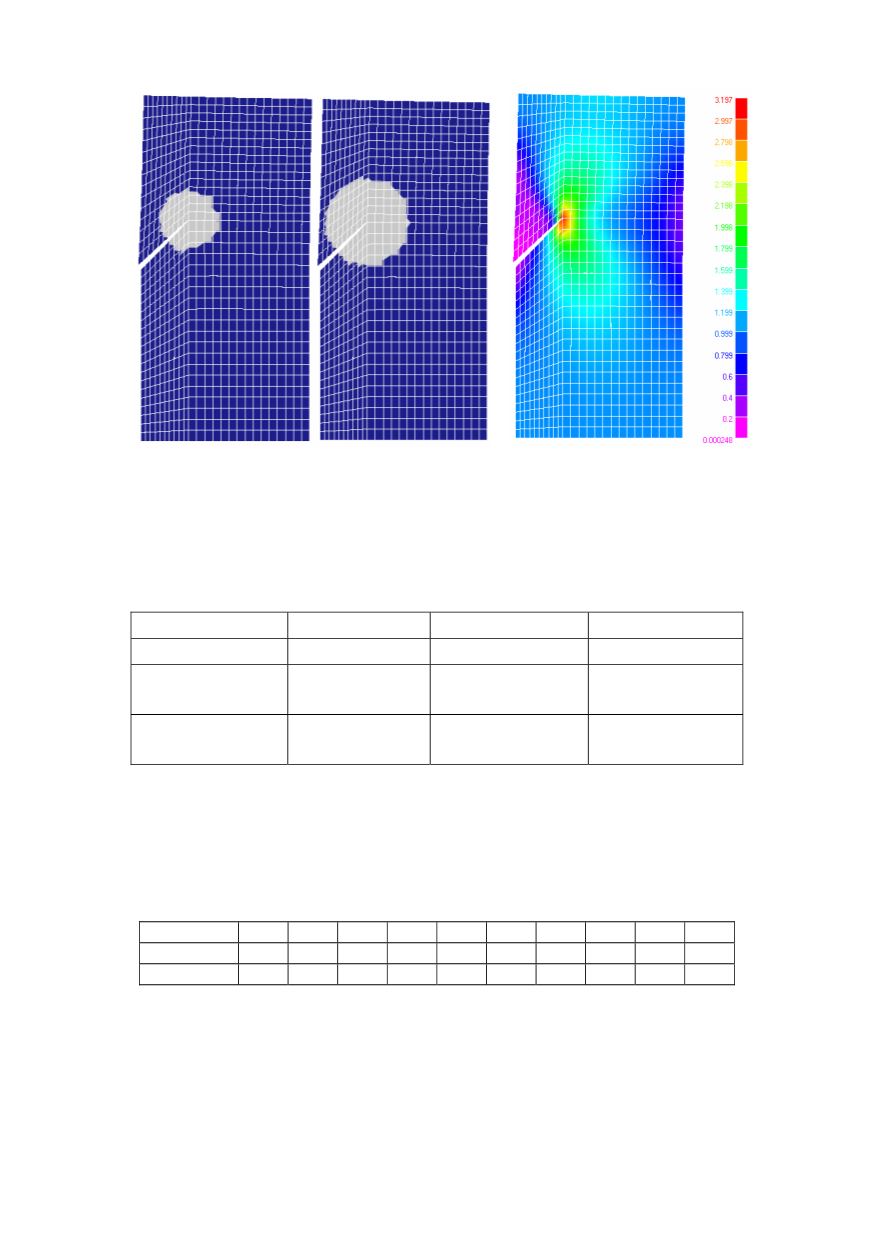
a)
b)
Figure 5. a) Domain integration for
J
–EDI. b) Von-Mises stress field
Results obtained by using
J
–EDI integral, incorporated in the PAK software, are
compared with results carried out with COSMOS
J
–contour integral, and are shown in
Table 1. Also, both sets of numerical results are compared with reference theoretical
values. Comparison is given as N/A%.
Table 1. Comparison of results
K
I
(N/A%)
K
II
(N/A%)
Reference
1.85
0.88
8-node Element
PAK
Path 1
Path 2
1.877 (1.4%)
1.907 (3.0%)
0.871 (1.0%)
0.907 (3.0%)
8-node element
COSMOS
Path 1
Path 2
1.80 (2.7%)
1.79 (3.2%)
0.872 (0.9%)
0.874 (0.6%)
In order to present robustness of the
J
–EDI procedure, built into the PAK software, the
above example was used with different radii
r
d
of the integration domain and the results
are shown in Table 2. Radius
r
d
varied from 0.5%
a
to 90%
a
, where
a
denotes crack
length. It can be concluded from Table 2
that results are insensitive to the choice of the
J
–
integral domain integration radius.
Table 2. Values of the factor
K
I
for different integration domain radii
r
d
(% of
a
)
5
15
25
35
45
55
65
75
85
90
K
I
1.810 1.864 1.807 1.877 1.906 1.90751.90711.9089 1.929 1.931
N/A(%)
2.1 0.75 2.3
1.4
3.0
3.1 3.08 3.20 4.20 4.37
It can be seen from the presented results that the error (N/A%) is small, even with a
non-symmetrical grid with respect to the crack.
Example 2
In this example [14], the stress intensity factor of the crack located in the steam
turbine housing 4 of TE Kolubara is calculated. After generating 2-D FE model of the
lower housing part, together with insulation, the following steps were carried out:
327