


 354 / 392

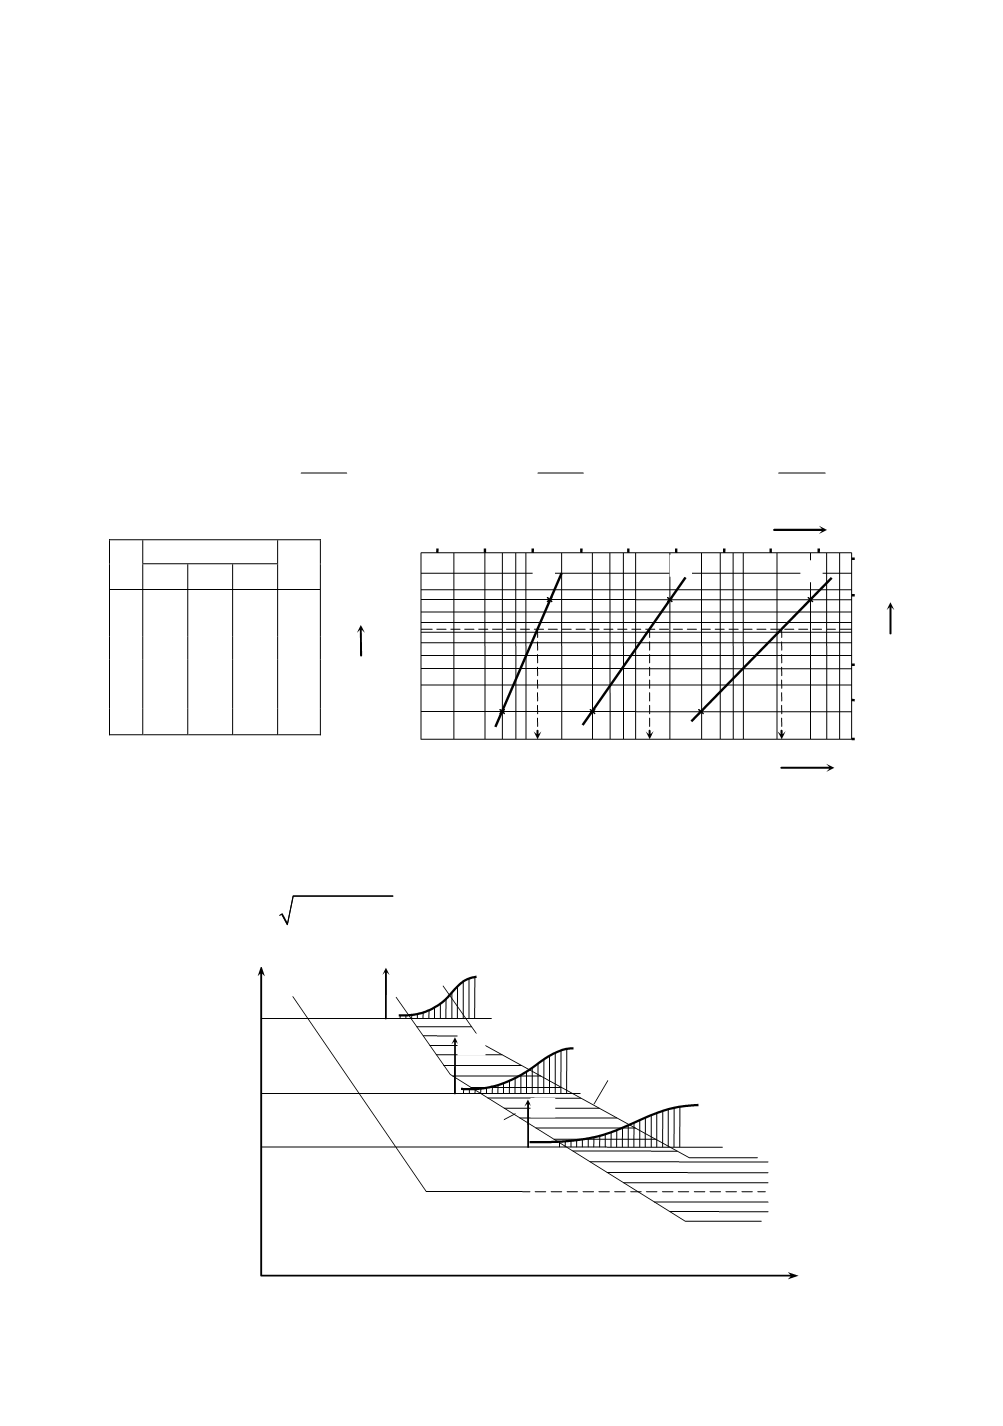
upper part of the service strength. The second level of the greatest stress in the spectrum
σ
R
″
should be in the upper region of the lower part. This condition is achieved if stress
levels in the stress spectrum are so adjusted that at least one stress level (the lowest) is
under the level of infinite life strength. The third level of the greatest stress in the
spectrum
σ
R
′″
should be on the level close to and above the range of infinite life strength
dissipation. For each of the chosen three levels of greatest stress in the stress spectrum
(service fatigue strength) a set of
z
Σ
test specimens is tested. Fractures occur at different
numbers of cycles
N
R
, following the same principle as in the range of finite life strength.
Classified by values, cycle numbers
N
R
may be presented as in the table in Fig. 18. The
calculated failure probabilities
P
R
for the respective cycle numbers are entered into
corresponding Weibull’s coordinate mesh. After approximating with a straight line, para-
meters of these distributions are determined. In the example in Fig. 18, for service fatigue
strength levels
σ
R
′
,
σ
R
″
,
σ
R
′′′
, the functions of distribution of failure probabilities are:
3.1
6
1.2 10
( ) 1
R
N
R R
P N e
⎛
⎞
−
⎜
⎟
⋅
⎝
⎠
= −
;
1.95
7
1.310
( ) 1
R
N
R R
P N e
⎛
⎞
−
⎜
⎟
⋅
⎝
⎠
= −
;
1.4
8
2.510
( ) 1
R
N
R R
P N e
⎛
⎞
−
⎜
⎟
⋅
⎝
⎠
= −
10
7
10
6
-2
-1
1
x
=ln
N
Y
0,99
12
10
5
10
8
10
9
2
-3
N
R
0
13
14 15 16 17 18 19
20
′
σ
R
′′
σ
R
′′′
σ
N
R
z
i
σ
'
R
σ
R
″
σ
R
'"
P
R
1
N
R
min
N
R
min
N
R
min
0.09
2 –
–
–
–
3 –
–
–
–
⋅
–
–
–
–
⋅
–
–
–
–
z
Σ
N
R
max
N
R
max
N
R
max
0.9
0,95
0,90
0,80
0,60
0,40
0,20
0,10
0,05
P
R
Figure 19. Distribution functions of the failure probability for service fatigue strength
Using the formed distribution functions, it is possible to calculate on each of the three
service fatigue strength levels the cycle numbers
N
R
for failure probabilities
P
R
= 0.1, 0.5,
and 0.9 from the expression obtained by the logarithm of Weibull’s function of failure
probability
ln(1 )
R
R
N
P
β
η
= − −
. By joining the points with the same failure probability
a dissipation range is formed by the lines for the probability
P
R
= 0.1 and 0.9 (Fig. 19).
P
R
P
R
P
R
P
R
=0,9
P
R
=0,1
log
σ
R
log
N
R
σ
R
'''
σ
R
''
σ
R
'
350
Figure 19. Dissipation of experimental data for service fatigue strength