


 350 / 392

tube fails before reaching the fixed post-limit cycle number
N
DV
the next one will be
tested with the first lower stress level. If it does not fail, it is considered that the stress
was small, thus the next one is tested with a greater stress. By “oscillating” on the steps
(Fig. 13b), the endurance limit is defined. The number of tested,
z
Σ
, and the number of
failed,
z
i
, specimens on each stress level, is obtained by counting. For the number of
tested specimens
z
Σ
to be sufficiently big, it is necessary that the total number of tested
specimens (parts) at all stress levels is sufficiently big. Even in such case at extreme
levels (the lowest and the highest), the number of tested pieces is small, i.e. less than the
limit number for the deduction of statistical conclusions. For a sufficient number
z
Σ
to be
achieved on these stress levels also, additional specimens (parts) are tested. In this way a
combination is made of the step method and the level method. The value of infinite life
strength (endurance limit) and the magnitude of the dissipation range are firstly deter-
mined with the help of the step method and then additionally, the level method is com-
pleted for the purpose of determining failure probability
P
R
=
z
i
/(
z
Σ
+ 1).
σ
N
σ
N
σ
N3
σ
N4
σ
N5
σ
N6
σ
N7
σ
N8
z
i
→
0
z
i
→
z
Σ
P
R
N
N
DV
z
Σ
z
i
N
N
DV
a)
b)
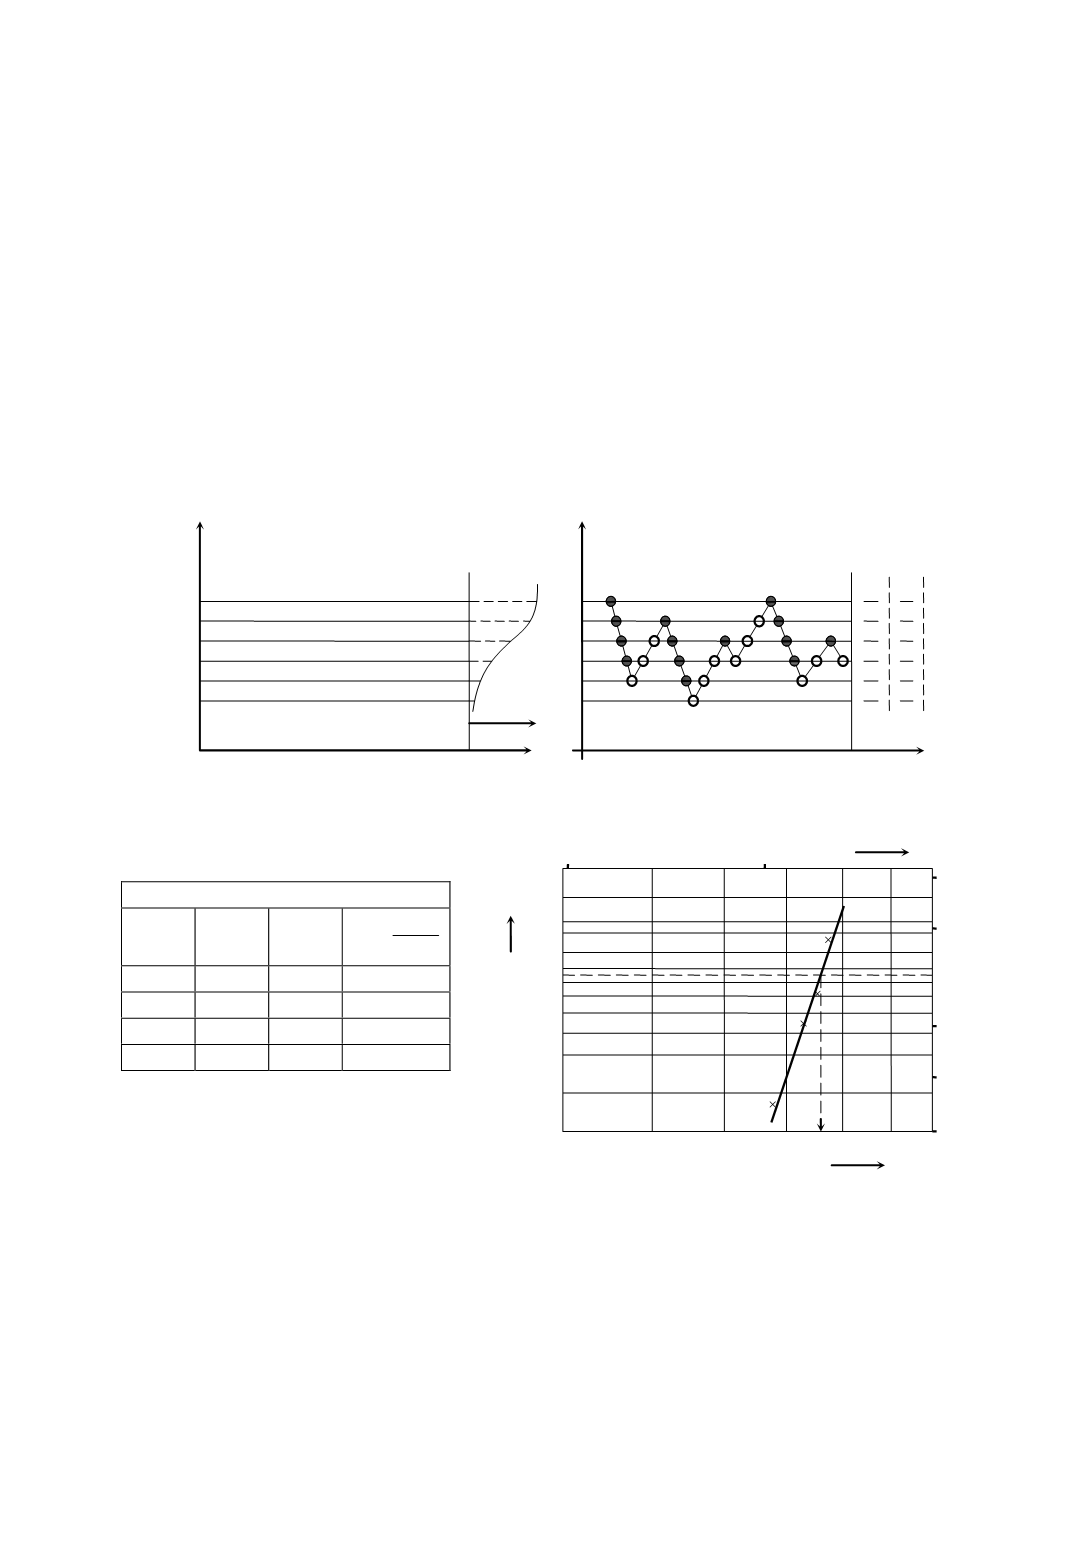
Figure 13. Failure probability testing in the range of infinite–life strength
a) level method, b) step method
-2
-1
1
2
-3
0
6
6,5
600 700 800 900 1000
346
400
500
0,99
0,90
0,80
0,60
0,40
0,20
0,10
P
R
x
=ln
N
σ
N
N/mm
2
N
DV
= 5·10
6
F
N
σ
N
N/mm
2
z
i
1
i
R
z
P
z
Σ
=
+
1200
777
9
0.818
1150
746
5
0.454
1100
713
4
0.363
1050
680
1
0.090
Figure 14. Definition of the parameters of Weibull’s distribution for the failure
probability in the range of infinite–life strength
The calculated failure probabilities
P
R
are entered into Weibull’s coordinate mesh for
respective stress values
σ
N
. After approximating this set of points by a straight line,
parameters are obtained of this distribution,
η
and
β
. Figure 14 gives an example of test
results of rotating specimens (Fig. 11a) with calculated failure probabilities. With
approximated straight line, parameters
η
= 760 N/mm
2
(for the probability
P
R
= 0.632)
and
β
= 23 (the part on the ordinate for
∆
X
= 1) are obtained. For these parameters the
Weibull’s distribution of failure probability for
N
DV
= 5·10
6
is