


 347 / 392

0
j
–1
j
j
+1
m
Figure 10. The statistical model of the fatigue process as defined by a series of current states
The failure probability is a cumulative probability that a machine part will fail under a
certain stress by a certain stress cycle number. This is also the probability that at a certain
stress cycle number, failures will occur at certain stresses. The failure probability is calcu-
lated on the basis of statistical processing of the testing results. That is the ratio of the
number of failed test samples (parts) under certain conditions and the number of tested
parts under such conditions. It is necessary to choose for testing, the stress values to
which the test samples, i.e. parts are to be exposed, then the number of pieces which are
to be tested, and the manner of achieving (simulating) the stress fluctuation. The number
of pieces (test samples or parts)
z
Σ
to be tested on each one of the chosen stress levels
should be sufficiently big so that, based on the sufficiently big set, it would be possible to
deduce statistical conclusions. A set greater than
z
Σ
= 20 test samples or parts is consid-
ered as sufficiently big. This testing work takes a lot of time with significant energy
consumption, and the tested parts are not for further use. It is therefore endeavoured to
reduce as much as possible the number of pieces to be tested. The smallest number of
pieces which still makes possible the deduction of statistical conclusions is
z
Σ
= 8. For
these small samples the failure probability is not defined as the ratio of the number of
failed
z
i
and tested pieces
z
Σ
, i.e. as
P
R
=
z
i
/
z
Σ
, but as by some of the approximate
expressions
1
i
R
z
P
z
Σ
=
+
;
0.5
i
R
z P
z
Σ
−
=
;
0.33
0.33
i
R
z P
z
Σ
−
=
−
l
σ
t
a)
b)
c)
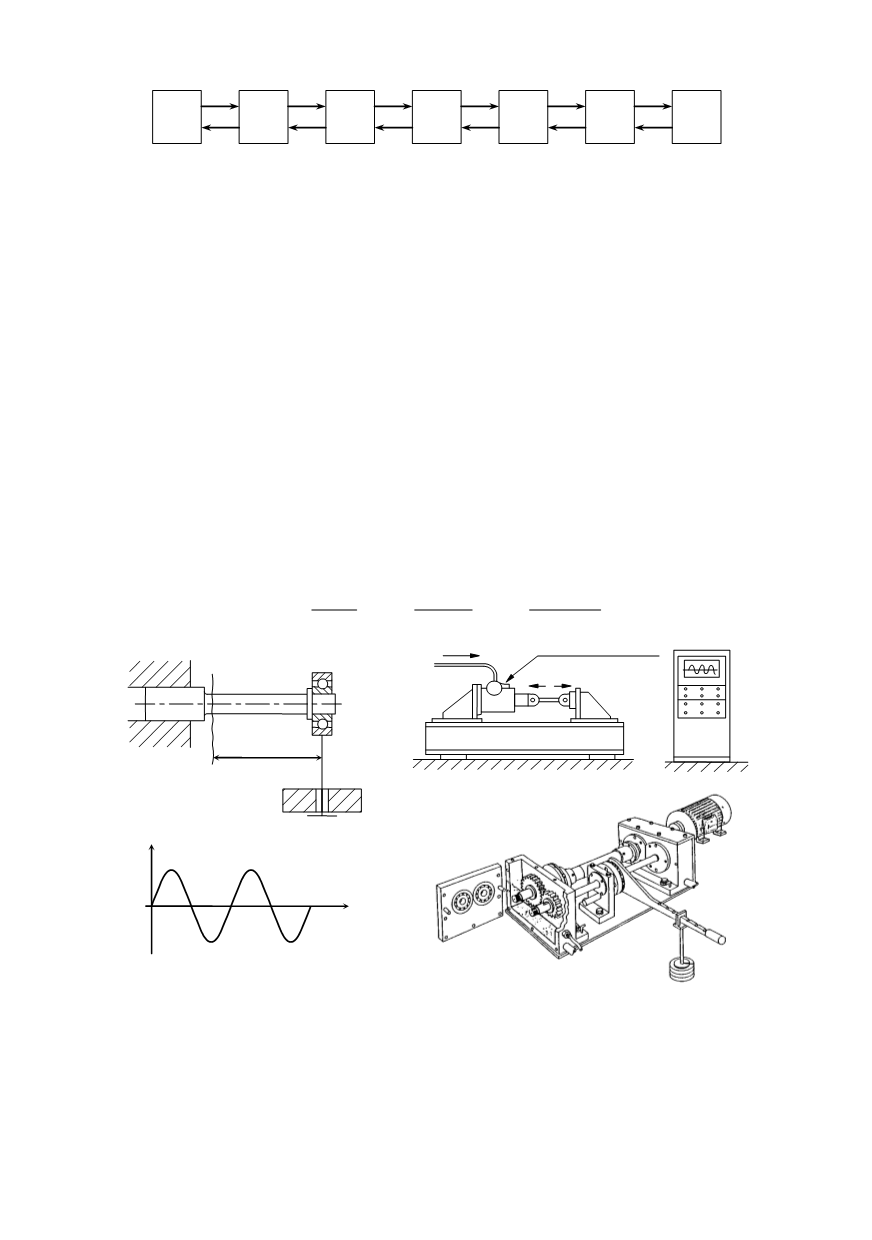
Figure 11. Some of the possibilities of simulation of the variable stress: a) rotary bending, b) axial
load through hydraulic machines, c) back to back system with power circulation
The manner of achieving (simulating) the fluctuating stress is another of the signifi-
cant issues which must be resolved at the performance of research. Figure 11 shows some
of the possibilities of achieving the fluctuating stress with constant amplitude. Rotating
test samples exposed to rotating bending (Fig. 11a) are simply loaded with calibrated
weights through roller bearings. Due to the rotation of test samples, reverse stress changes
343