


 299 / 392

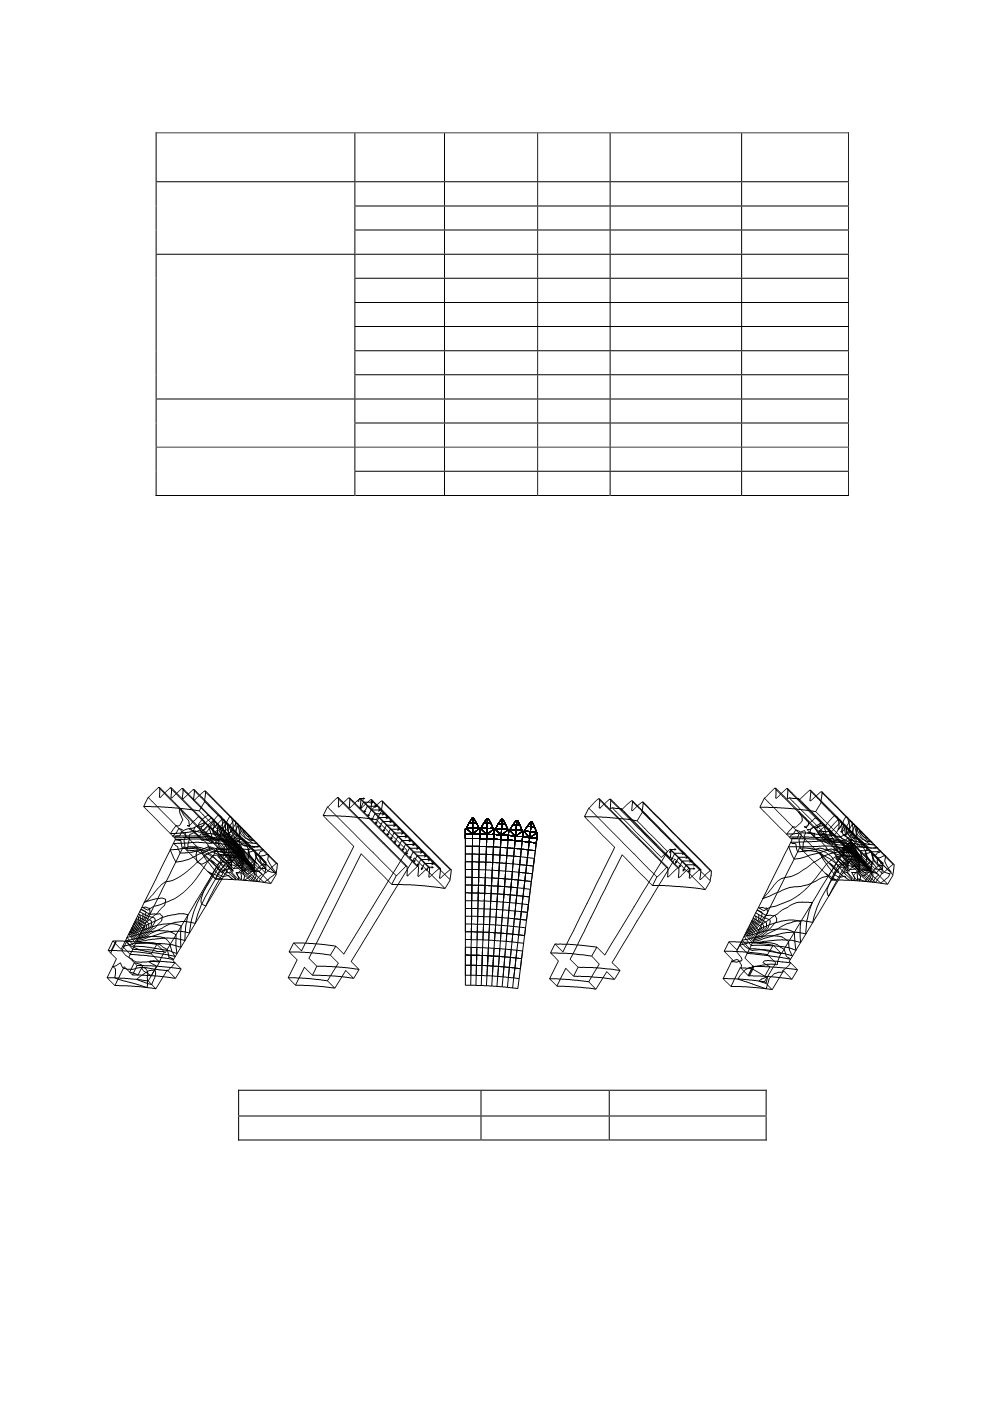
Table 12. Computational results
Models and variants Thickness
δ
1
[
cm
]
Thickness
δ
2
[
cm
]
Max.
D
[
cm
]
Max. stress
kN/cm
2
Max. stress
sleeve
Model A var 1
2.75
4.50
2.70
27.5
27.5
var 2
4.05
5.75
2.66
16.9
15.0
var 3
6.00
7.75
2.62
16.9
10.0
Model B var 1
2.75
4.50
2.72
25.7
25.7
var 2
4.05
5.75
2.67
16.9
16.0
var 3
6.00
7.75
2.63
16.9
10.0
var 4
5.00
6.65
2.65
16.9
12.0
var 5
5.50
6.65
2.65
16.9
11.0
var 6
5.75
7.50
2.63
16.9
10.0
Model C var 1
4.50
4.50
2.68
16.9
16.0
var 2
5.75
5.75
2.65
16.9
11.5
Model D var 1
4.50
6.25
2.66
16.9
14.0
var 2
5.75
7.50
2.64
16.9
11.0
3.13. Recovery of the fractured tooth (containing cracks)
In order to define recovery procedures, if possible, two 3D models of 5 teeth (0 and 1
in Fig. 34) and the stress distribution have been analysed after gear-wheel failure in the
Cement Factory mill, in Beočin. The behaviour of the fractured tooth part (170 mm in
length) has been correlated to the entire tooth length of 650 mm behaviour (without
cracks). Note that the position of the stress lines is similar in both cases (the stress in
model 1 is about 20% higher than in model 0, Table 13). So it is concluded that the frac-
tured tooth can be in function.
The fine 3D model consisted of 13 869 nodal points and 11 352 volumes. It confirmed
the conclusion obtained using the first model.
Stress 0–14 kN/cm
2
Model 0
Model
Model 1
Stress 0–14 kN/cm
2
Figure 34. Models and stress fields in loading 2
Table 13. Stress ratios of models 0 and 1, at two loading conditions
Maximal stress
[
kN/cm
2
]
Loading 1
Loading 2
Model 0/Model 1
7.8/10
26/32.8
To get more closer insight, the fine 2D model of a single tooth is also prepared and
analysed. Obtained results are presented in Fig. 35 and in Table 14. The zone, which must
not have cracks, is the area limited within the lines at a distance of about 25 mm from the
top of the tooth and about 15 mm from the side of the tooth (see Fig. 36).
The fine 2D model of five teeth with appropriate supports and loads confirmed results
obtained by the single tooth model.
295