


 85 / 352

81
0.0
0.2
0.4
0.6
0.8
0
10
20
30
40
50
60
70
80
90
100
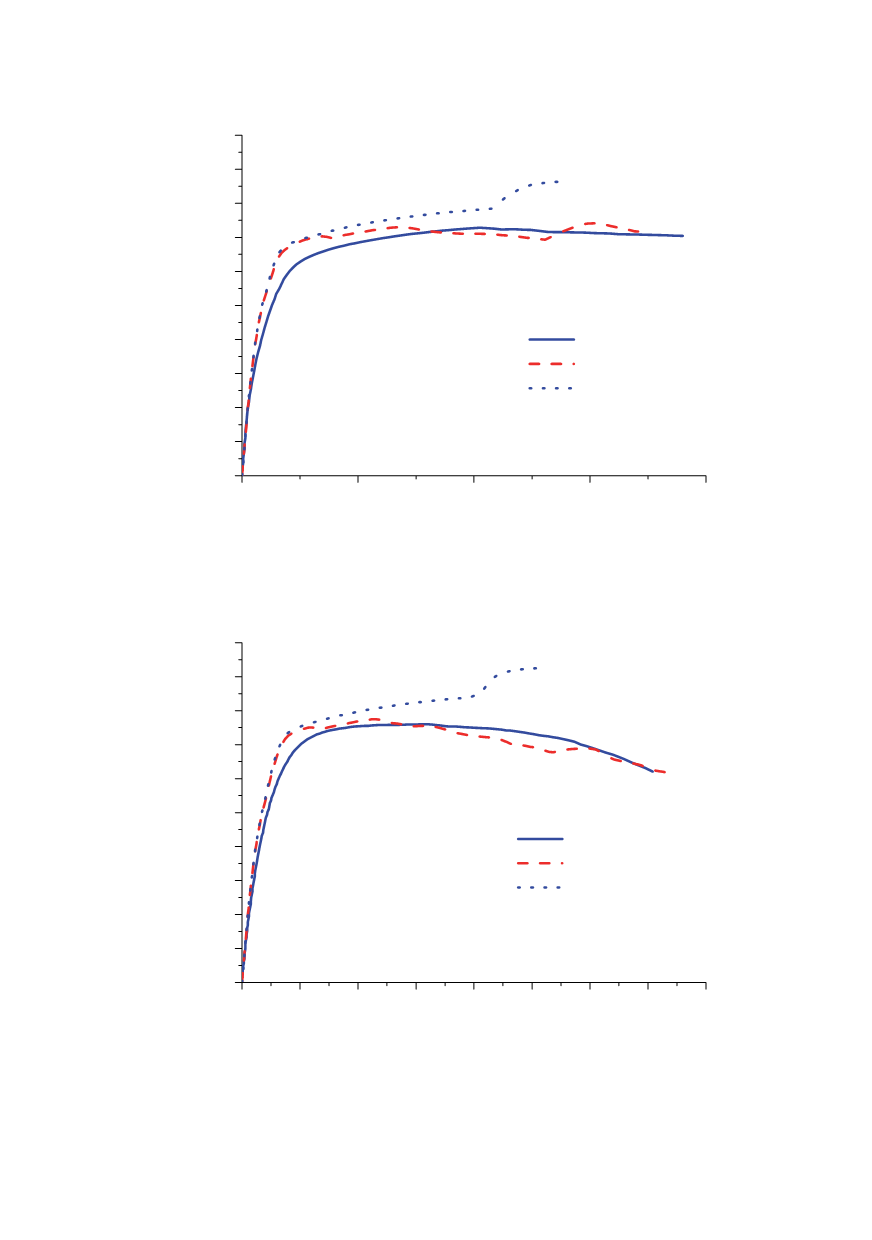
initial crack length
a
0
= 8 mm
Experiment
CGM
von Mises
WM 6
F [kN]
CTOD [mm]
Figure 12:
F
-CTOD curves obtained experimentally, using von Mises criterion (without crack
growth) and the CGM (with crack growth) for joint width 6 mm
0.0 0.1 0.2 0.3 0.4 0.5 0.6 0.7 0.8
0
10
20
30
40
50
60
70
80
90
100
initial crack length
a
0
= 8 mm
Experiment
CGM
von Mises
CTOD [mm]
F [kN]
WM 12
Figure 13:
F
-CTOD curves obtained experimentally, using von Mises criterion (without crack
growth) and the CGM (with crack growth) for joint width 12 mm