


 83 / 352

79
reduced integration and dimensions 0.075x0.075 mm. These two elements have similar
distance between integration points, so these results are in agreement with the conclusions
of Rakin /25/, that distance between integration points, instead of the FE size, should be
related to the mean free path between the void-nucleating particles.
0.04
0.06
0.08
0.10
0.12
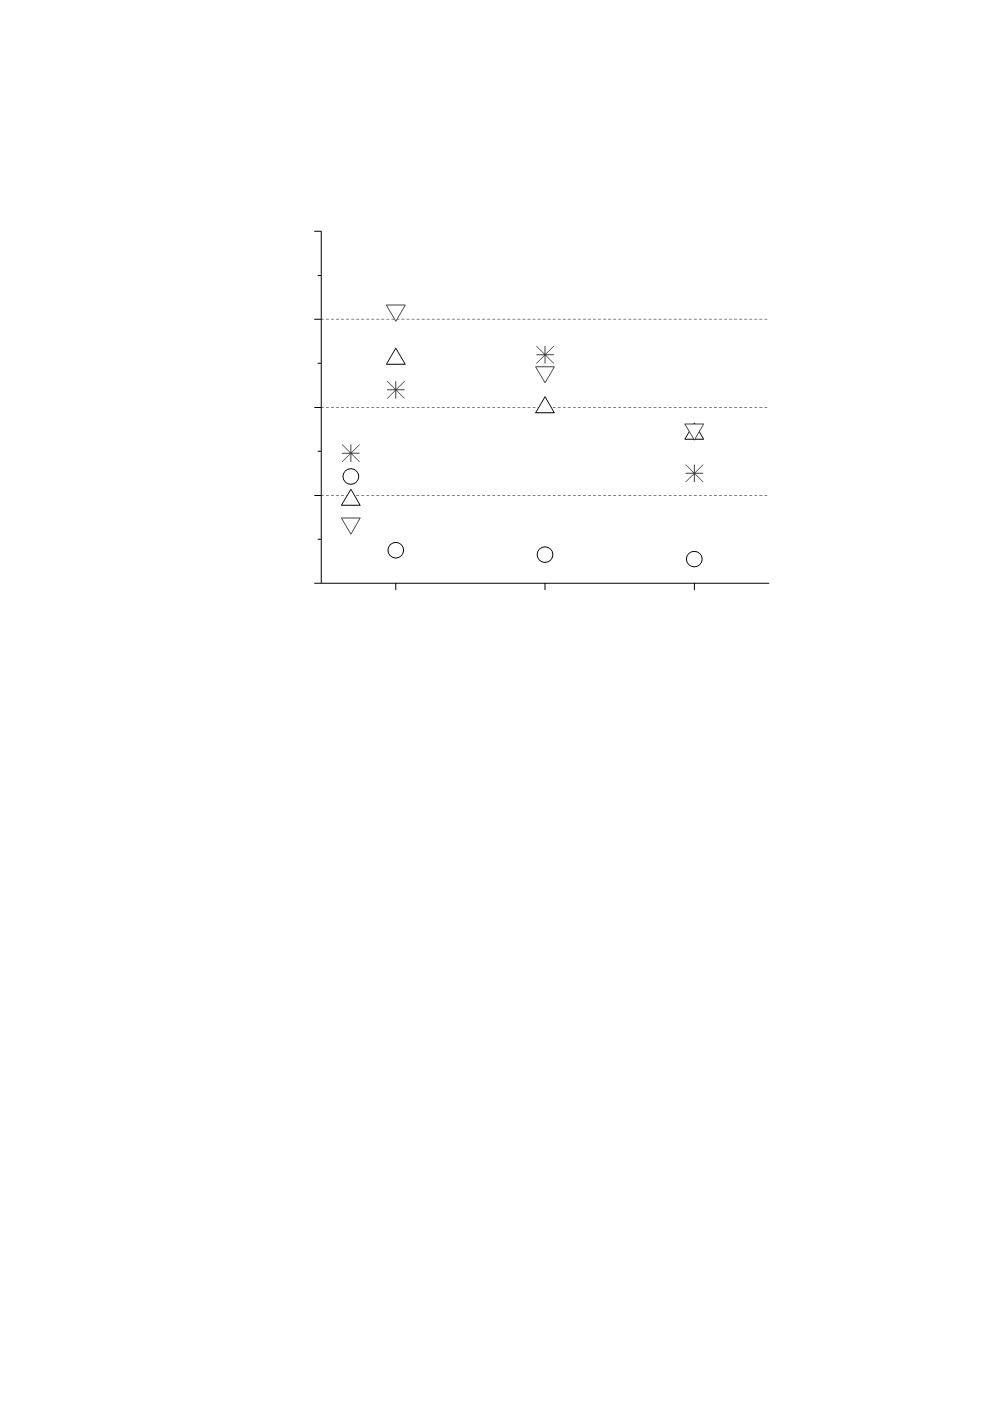
Exp.
CGM, 8-noded FE, full int. (3x3)
CGM, 8-noded FE, reduced int. (2x2)
CGM, 4-noded FE, full int. (2x2)
2
H
[mm]
CTOD
i
[mm]
18
12
6
Figure 9: The influence of interpolation and integration on the CTOD
i
values (FE 0.15x0.15 mm)
On the other hand, for the same number of integration points and distance between
them, prediction of ductile fracture initiation is not much affected by the change of the
interpolation order. Result obtained using 8-noded and 4-noded elements with 2x2
integration do not differ significantly, as can be seen in Fig. 9.
5.4. Stable crack growth
Stable crack growth is modelled by development of damage in the ligament ahead the
crack tip. The criterion for the loss of load-carrying capacity of the material is defined
applying the CGM. The FE meshes are created using 4-noded elements with full (2x2)
integration and dimensions in the ligament 0.15x0.15 mm. Deformed mesh of the speci-
men of joint width 12 mm, for load line displacement
v
LL
= 1.6 mm, is shown in Fig. 10.
The influence of the joint width on the crack growth can be seen in Fig. 11, where the
ligament meshes in front of the crack tip for three analysed widths are given. Dark
colours represent high values of void volume fraction (porosity)
f
, in elements that have
already lost their load-carrying capacity. The current crack length is determined by
multiplying the number of failed elements with their dimension in crack growth direction
(which is 0.15 mm for the meshes in Fig. 11). It can be concluded that the influence of the
geometry is similar as for the crack growth initiation - increase of the joint width reduces
the fracture resistance. This dependence can be seen as the increase of the crack length,
having in mind that three porosity fields given in Fig. 11 correspond to the same value of
the load line displacement
v
LL
= 1.6 mm.
The results obtained by crack growth modelling are shown in Fig. 12 - 16, on force
F
-
crack tip opening displacement CTOD diagrams. Experimentally obtained curves for the
three joint widths are compared with the results obtained using von Mises plastic yield