


 215 / 352

211
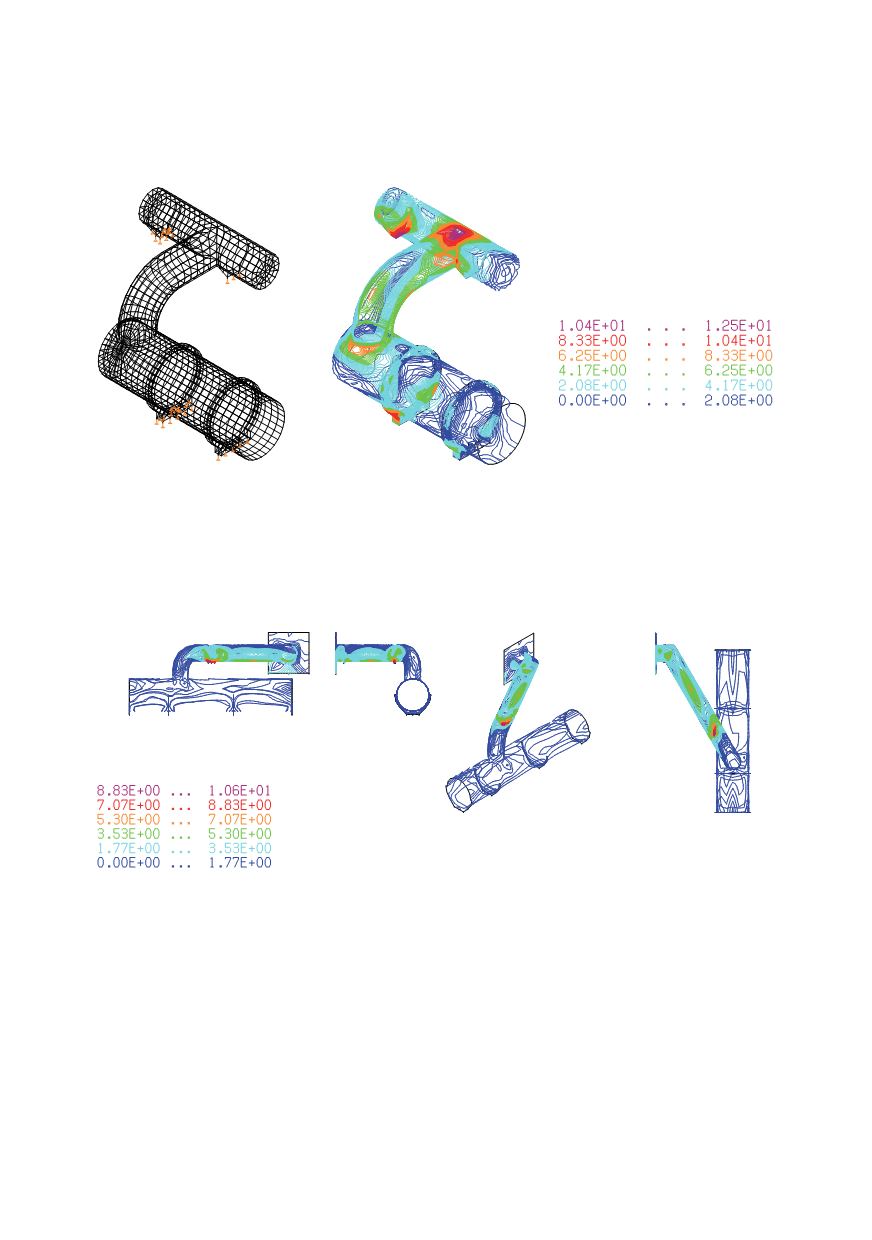
Segment 9 – adsorbed (entrance part) -
3000x8 /
2000x8
Stress distribution in segment 9 due to thermo mechanical loading is shown in Fig.4.5.
Figure 4.5: Stress due to thermo mechanical loading [kN/cm
2
]
Maximal deformation of segment 9 forthermo mechanical loading is
f
max
= 3.89 cm.
Segment 16 – bypass 2
2000x8 /
4000
[kN/cm
2
]
Figure 4.6: Stress distribution at the temperature 250
o
C for the pipe diameter
4000 mm
Performed analysis of complete gas pipeline in the company RTB BOR allowed to
derive following conclusions:
1.
Analysiswere done for temperatures higher then operating, assuming that the
temperature field in one segment is homogeneous.
2.
Calculated results present maximal stresses at stress concentrations sites; calculated
values of stresses are lower than allowed stress values for corresponding temperature.
The behaviour of gas pipeline as a whole is assessed as satisfactory.
Regular inspection of the construction and supports state has been recommended.
Thermal dilatation of fixed supports should be provided.